First, the posted code had a small bug. Basically there is a superfluous internal loop that does nothing (except add to the run time). This got inserted while I was programming & testing the function, and I forgot to remove it. The updated version is here.
This new version of the function also has a method, logarithm=TRUE, which fits exp(ancestors of x)~contrasts(y). This just allows for the possibility that the rate changes as a multiplicative function of x, I think.
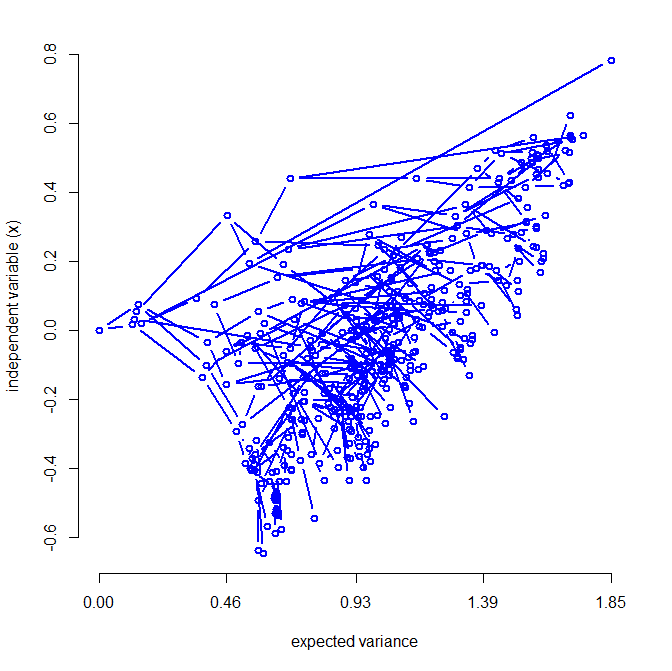
Finally, there is a new function - sim.ratebystate - which simulates under each of the assumed models. Here's a quick demo:
> tree<-pbtree(n=200,scale=1)
> source("ratebystate.R")
> XY<-sim.ratebystate(tree,sig2x=0.1,method="by.branch", plot=TRUE,beta=c(0,2))
> source("ratebystate.R")
> XY<-sim.ratebystate(tree,sig2x=0.1,method="by.branch", plot=TRUE,beta=c(0,2))
> ratebystate(tree,XY[,"x"],XY[,"y"],method="by.branch")
$beta
[1] 2.069869
$r
[1] 0.2875908
$P
[1] 0.01
$corr
[1] "pearson"
$method
[1] "by.branch"
$beta
[1] 2.069869
$r
[1] 0.2875908
$P
[1] 0.01
$corr
[1] "pearson"
$method
[1] "by.branch"
I also built a new version of phytools (phytools 0.2-26) that can be downloaded and installed from source.
I should say it fits contrasts(y)~exp(ancestors of x) when logarithm=TRUE.
ReplyDelete