A phytools user today contacted me to ask about an evident discrepancy between an LTT plot (which on average seemed to be curved upward), and a calculated value of Pybus & Harvey's (2000) γ statistic (which was nonsignificant but negative). Visually, to me it seemed that this was most likely explained by a notable slightly negative curvature of the LTT plot towards the present day where there are many more internode distances. However, it also occurred to me that we can easily plot γ through time as well, and this might help us to see what parts of our plot are influencial in the measured value of γ.
Note that this assumes a pure-birth process of lineage accumulation through time. If we have extinction (which, in general, should result in positive γ), we need the 'pull of the present' to detect it, and by slicing of the end of our tree in computing γ we might find a value close to zero rather than positive!
Here are our functions:
gtt<-function(tree,n=100,...){
if(hasArg(plot)) plot<-list(...)$plot
else plot<-FALSE
obj<-ltt(tree,plot=FALSE)
t<-obj$times[which(obj$ltt==3)[1]]
h<-max(nodeHeights(tree))
x<-seq(t,h,by=(h-t)/(n-1))
trees<-lapply(x,treeSlice,tree=tree,orientation="rootwards")
gamma<-sapply(trees,function(x,plot){
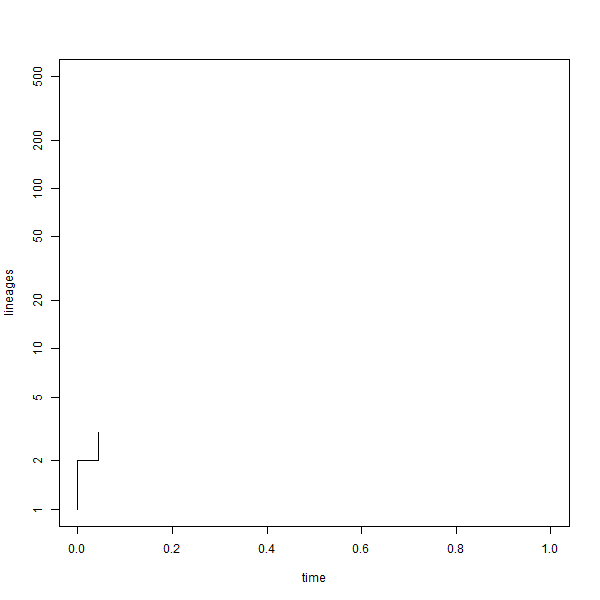
obj<-unlist(gammatest(ltt<-ltt(x,plot=FALSE)));
if(plot) plot(ltt,xlim=c(0,h),ylim=c(1,Ntip(tree)),
log.lineages=FALSE,log="y");
Sys.sleep(0.01);
obj},plot=plot)
object<-list(t=x,gamma=gamma[1,],p=gamma[2,],tree=tree)
class(object)<-"gtt"
object
}
## plot method
plot.gtt<-function(x,...){
args<-list(...)
args$x<-x$t
args$y<-x$gamma
if(!is.null(args$show.tree)){
show.tree<-args$show.tree
args$show.tree<-NULL
} else show.tree<-TRUE
if(is.null(args$xlim)) args$xlim<-c(0,max(x$t))
if(is.null(args$xlab)) args$xlab<-"time"
if(is.null(args$ylab)) args$ylab<-expression(gamma)
if(is.null(args$lwd)) args$lwd<-3
if(is.null(args$type)) args$type<-"s"
do.call(plot,args)
if(show.tree) plotTree(x$tree,add=TRUE,ftype="off",mar=par()$mar,
xlim=args$xlim,color=make.transparent("blue",0.1))
}
print.gtt<-function(x,...)
cat("Object of class \"gtt\".\n\n")
Let's try it with a simulated tree:
library(phytools)
tree
##
## Phylogenetic tree with 500 tips and 499 internal nodes.
##
## Tip labels:
##  t106, t107, t97, t451, t452, t75, ...
##
## Rooted; includes branch lengths.
object<-gtt(tree)
object
## Object of class "gtt".
plot(object)

Note that since our intervals are evenly spaced, rather than linked to events on the tree, the choice of a 'step' line plot is purely cosmetic and I could've also used straight lines:
plot(object,type="l")

The function gtt has an option plot=TRUE
that will create an animation of the LTT plot for the tree. Something like
this:
object<-gtt(tree,plot=TRUE)
The .gif was generated in R using ImageMagick as follows:
png(file="gtt-%03d.png",width=600,height=600)
object<-gtt(tree,plot=TRUE)
dev.off()
system("ImageMagick convert -delay 10 -loop 0 *.png gtt-anim.gif")
file.remove(list.files(pattern=".png"))
Thank you so much for this detailed and complete difference between LTT plot and Pybus & Harvey's y statistics. I think I will agree with you now.
ReplyDelete