Tuesday, March 25, 2014

New version of Rphylip with Rseqboot & demo

I just submitted a new version (Rphylip 0.1-23) of the Rphylip package ('an R interface for PHYLIP') to CRAN. This version fixes a couple of bugs in the first CRAN version - including taxon name length limits in Rconsense and Rtreedist (which are present in the corresponding PHYLIP programs CONSENSE and TREEDIST, but can easily be circumvented when calling PHYLIP from within R). It also introduces the new function Rseqboot, which is an R interface two SEQBOOT. SEQBOOT implements a range of non-parametric bootstrapping, jacknife, and data permutation methods. Because it can take a variety of different character types as input, writing the interface was a bit of a pain in the butt - but it is finished to my satisfaction today.

Here's a demo of bootstrapping, distance matrix calculation from all bootstrap samples, and then consensus phylogeny estimation using the Rphylip package:

> require(Rphylip)
Loading required package: Rphylip
> packageVersion("Rphylip")
[1] ‘0.1.23’
> ## load primate dataset
> data(primates)
> ## basic bootstrapping
> X<-Rseqboot(primates,quiet=TRUE)
> ## compute distance matrices
> D<-lapply(X,Rdnadist,quiet=TRUE)
> ## compute all NJ trees
> ## note Rneighbor(...,quiet=TRUE) is
> ## not as quiet as it should be!
> trees<-lapply(D,Rneighbor,quiet=TRUE)
> ## reroot all trees using midpoint rooting
> require(phangorn)
Loading required package: phangorn
> trees<-lapply(trees,midpoint)
> class(trees)<-"multiPhylo"
> ## compute consensus tree
> tree<-Rconsense(trees,quiet=TRUE,rooted=TRUE)
> ## now plot the result with the bootstrap %s
> plot(tree,edge.width=2,no.margin=TRUE)
> ## find edges
> e<-sapply(2:tree$Nnode+length(tree$tip.label),
 function(x,y) which(y==x),y=tree$edge[,2])
> ## add bootstrap
> edgelabels(tree$node.label[2:tree$Nnode],e,pos=3,
 frame="none",bg="transparent")

Cool. Note that RETREE in PHYLIP does midpoint rooting, but this program cannot yet be called with Rphylip. The same general pipeline could be used with ML, MP, or other phylogeny inference methods in PHYLIP (although this would be slower, of course).

This version of Rphylip is already available from GitHub, but hopefully will also be accepted on CRAN soon.

Friday, March 14, 2014

Putting a barplot next to a plotted tree

Today a phytools user contacted me about creating a plot that looks like this. Well, I'm not going to try to duplicate this exactly, but here is a quick demo about how to put a bar plot next to a plotted tree with a continuous character map overlain:

## first let's simulate some tree & data to work with
tree<-pbtree(n=40)
x<-fastBM(tree)

Now let's create our plot:

## create a split plot
layout(matrix(c(1,2),1,2),c(0.7,0.3))
## plot our tree
xx<-contMap(tree,x,mar=c(4.1,1.1,1.1,0),res=200,plot=FALSE)
plot(xx,legend=FALSE,mar=c(4.1,1.1,1.1,0))
## click to add legend interactively
add.color.bar(1,cols=xx$cols,lims=xx$lims,title="")
## add bar plot
par(mar=c(4.1,0,1.1,1.1))
barplot(x[tree$tip.label],horiz=TRUE,width=1,space=0,
  ylim=c(1,length(tree$tip.label))-0.5,names="")

Obviously, the same approach could be used with an ordinary right-facing phylogram or a stochastic character mapped tree.

Wednesday, March 12, 2014

roundPhylogram now in phytools

A slightly more fully functional version of roundPhylogram (described on the blog earlier today) is now part of the phytools package. The function source code can be viewed here, and updated phytools package source can be downloaded from the phytools page.

Here's a demo, using the Caribbean anole tree:

> require(phytools)
Loading required package: phytools
Loading required package: ape
Loading required package: maps
Loading required package: rgl
> packageVersion("phytools")
[1] ‘0.3.97’
> data(anoletree)
> roundPhylogram(anoletree,ftype="i",fsize=0.7)

Plotting a right-facing round phylogram

Don't ask me why I'm working on this. Here's how to do it:

roundPhylogram<-function(tree){
  n<-length(tree$tip.label)
  # reorder cladewise to assign tip positions
  cw<-reorder(tree,"cladewise")
  y<-vector(length=n+cw$Nnode)
  y[cw$edge[cw$edge[,2]<=n,2]]<-1:n
  # reorder pruningwise for post-order traversal
  pw<-reorder(tree,"pruningwise")
  nn<-unique(pw$edge[,1])
  # compute vertical position of each edge
  for(i in 1:length(nn)){
    yy<-y[pw$edge[which(pw$edge[,1]==nn[i]),2]]
    y[nn[i]]<-mean(range(yy))
  }
  # compute start & end points of each edge
  X<-nodeHeights(cw)
  ## end preliminaries
  # open & size a new plot
  plot.new(); par(mar=rep(1.1,4))
  plot.window(xlim=c(0,1.05*max(X)),ylim=c(1,max(y)))
  # plot edges
  for(i in 1:nrow(X)){
    b<-y[cw$edge[i,1]]
    c<-X[i,1]
    d<-if(y[cw$edge[i,2]]>y[cw$edge[i,1]]) 1 else -1
    xx<-X[i,2]
    yy<-y[cw$edge[i,2]]
    a<-(xx-c)/(yy-b)^2
    curve(d*sqrt((x-c)/a)+b,from=X[i,1],to=X[i,2],add=TRUE,
      lwd=2)
  }
  # plot tip labels
  for(i in 1:n)
    text(X[which(cw$edge[,2]==i),2],y[i],tree$tip.label[i],
      pos=4,offset=0.3,font=2)
}

Now let's see how it works:

> library(phytools)
> source("roundPhylogram.R")
> tree<-pbtree(n=26,tip.label=LETTERS[26:1])
> roundPhylogram(tree)

Tuesday, March 11, 2014

Rphylip now on CRAN!

Rphylip, an R interface for J. Felsenstein's PHYLIP phylogeny methods program package, is now on CRAN.

Rphylip is a collaborative project with Scott Chamberlain at Simon Fraser University. Although I did most of the programming of Rphylip, Scott wrote some of the initial interface code that helped me to get started on the project, he has helped to debug the package, he has contributed some of the example datasets, and he is co-authoring the program note that we are presently preparing for journal submission.

Rphylip now contains interface functions for close to 90% of the programs of the PHYLIP package. In almost every case, all or nearly all of the functionality of the PHYLIP programs are transferred to the R user. The Rphylip functions, like PHYLIP itself, cover an enormous range of applications - from phylogeny inference, to distance matrix calculation, to phylogenetic comparative methods. In every case, we have done our best to preserve all the functionality of the PHYLIP programs while allowing them to be integrated seamlessly into an R workflow. Rphylip also contains a number of helper functions which both broaden the functionality of PHYLIP (albeit slightly), and allow it to be more easily used. For instance, the user does not necessarily need to supply the path to the PHYLIP executable. If a path is not supplied, then Rphylip will search common locations for the PHYLIP executables (such as in C:\Program Files\ on a Windows machine. Rphylip even includes a function (setupOSX) that automates the somewhat complicated procedure of installing PHYLIP to a Mac OS X computer.

Of course, before Rphylip can be used, PHYLIP must first be installed. Furthermore, any use of Rphylip in publication should automatically trigger a citation of PHYLIP (as well as relevant references for the particular method employed).

This release of Rphylip in advance of submitting our program note for publication should be considered highly beta. We welcome any feedback on the package or its use. At the moment of writing, only the package source and Mac OS binary are available. I expect that a Windows package binary should be posted soon.

Finally (oops!) I accidentally misentered the package name in the R package DESCRIPTION file which is responsible for the double ("Rphylip: Rphylip: .....") package header on CRAN. I'm aware of this & it will be fixed in future releases.

Function to quickly compute the height above the root of a pair of taxa

Today I received the following phytools user request:

I've been using your phytools package (and the findMRCA function with type="height" to find the height of a specific node in a phylogenetic tree. However, the computation time is rather long for my purpose and I was thinking about using fastMRCA. However, this outputs only the node number of the parental node. Is there a chance to get the coalescent time of this node (as with the type argument of findMRCA). Or do you have a general other suggestion to increase speed (I would really only need to calculate the time of coalescence of two tips of the tree).

Unfortunately, it doesn't matter which (findMRCA or fastMRCA) is used in this case because the bottleneck is nodeHeights, which is used to compute the height of the common ancestor above the root. Here's a quick demo to illustrate that:

> ## simulate a large tree
> tree<-pbtree(n=10000)
> ## using findMRCA
> system.time(h1<-findMRCA(tree,c("t1","t100"),
 type="height"))
   user  system elapsed
  27.67    0.00   27.90
> h1
[1] 2.148063
> ## using fastMRCA & nodeHeights
> system.time(h2<-nodeHeights(tree)[which(tree$edge[,1]==
 fastMRCA(tree,"t1","t100"))[1],1])
   user  system elapsed
  27.13    0.00   27.17
> h2
[1] 2.148063
> ## this is almost completely driven by nodeHeights
> system.time(H<-nodeHeights(tree))
   user  system elapsed
  26.74    0.00   26.77

However, we can take a different approach. What if we instead (1) found all the ancestors (back to the root) of each tip, (2) identified the intersection of these two sets, and (3) summed the parent branch length for each ancestral node above the root in the intersection? Here's a function that does this and it runs pretty fast!

fastHeight<-function(tree,sp1,sp2){
  ancs<-phytools:::getAncestors
  a1<-ancs(tree,which(tree$tip.label==sp1))
  a2<-ancs(tree,which(tree$tip.label==sp2))
  a12<-intersect(a1,a2)
  if(length(a12)>1){
    a12<-a12[2:length(a12)-1]
    h<-sapply(a12,function(i,tree)
      tree$edge.length[which(tree$edge[,2]==i)],tree=tree)
    return(sum(h))
  } else return(0)
}

In use with the same example as before:

> system.time(h3<-fastHeight(tree,"t1","t100"))
   user  system elapsed
   0.01    0.00    0.01
> h3
[1] 2.148063

I will probably put this in phytools.

Thursday, March 6, 2014

New function cladelabels

I just added a new function cladelabels to the phytools package. This function is in some ways analogous to nodelabels, tiplabels, etc. in ape. It basically implements the method I gave here, while taking advantage of the trick described here.

The code for this function is here, and it is also in a new phytools version, which can be downloaded here.

Here's a demo:

## this is just code to get a "realistic" looking tree
tree<-pbtree(n=26,tip.label=
  paste(LETTERS,"._",sapply(round(runif(n=26,min=3,max=6)),
  function(x) paste(sample(letters,x),collapse="")),sep=""),
  scale=1)
tree$edge.length<-tree$edge.length+0.1*rchisq(n=
  length(tree$edge.length),df=10)/10
plotTree(tree) ## also can use plot.phylo
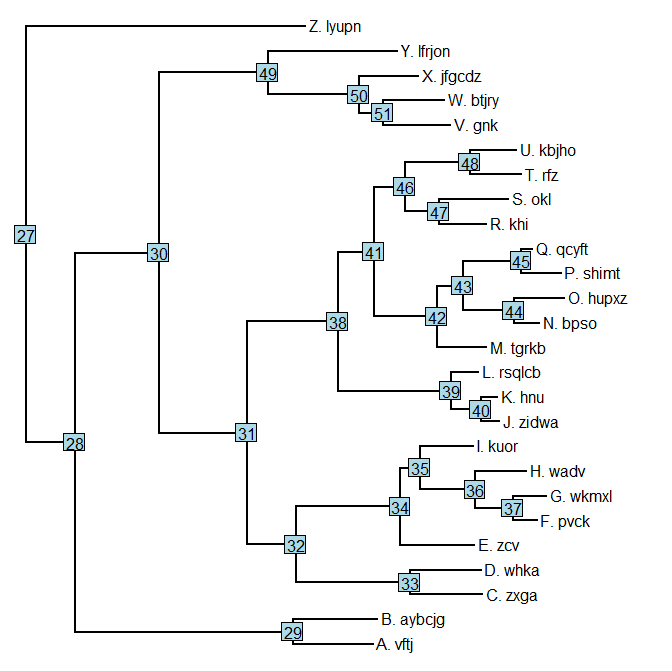
nodelabels()

Now let's label the three clades descended from nodes 46 & 33; and then also node 28 (which is inclusive of node 33:

## adjust xlim to make sure there is space
plotTree(tree,xlim=c(0,1.25*max(nodeHeights(tree))),
  ftype="i")
cladelabels(tree,node=49,"Clade A")
cladelabels(tree,node=34,"Clade B")
cladelabels(tree,node=31,"Clade C",offset=3))

Cool - this was more or less what we were going for. We can also do this without sending cladelabels the tree, although in this case we need to provide some guidance on the space that cladelabels should leave for tip labels - otherwise it will assume a fixed width of 8 characters.

plotTree(tree,xlim=c(0,1.25*max(nodeHeights(tree))),
  ftype="i")
## delete the tree! (we really don't need it)
rm(tree)
cladelabels(node=49,text="Clade A",offset=4.5)
cladelabels(node=34,text="Clade B",offset=6)
cladelabels(node=31,text="Clade C",offset=9)

It's also fairly obvious how this could be combined with findMRCA to label clades on the basis of the taxa in the clade, rather than their specific MRCA node number. For instance:

plotTree(tree,xlim=c(0,1.25*max(nodeHeights(tree))),
  ftype="i")
tips<-c("L._rsqlcb","J._zidwa","K._hnu","M._tgrkb",
  "N._bpso","O._hupxz","P._shimt","Q._qcyft",
  "R._khi","S._okl","T._rfz","U._kbjho")
cladelabels(tree,node=findMRCA(tree,tips),text="clade D",
  offset=2)

Finally, it's possible to send the function multiple node numbers & clade labels in one function call - although at present this does not permit us to use different offset values. So:

cladelabels(tree,node=49,"Clade A")
cladelabels(tree,node=34,"Clade B")
## is the same as:
cladelabels(tree,node=c(49,34),text=c("Clade A","Clade B"))

One caveat important to mention is that at present this works only for rightward facing phylograms (or cladograms, for tree=NULL). This is not theoretically difficult to extend to other plot types, it just requires more work.