Wednesday, April 17, 2013

New version of estDiversity with multiple methods

I just posted a new version of the function estDiversity, which also adds a new method for computing the reconstructed diversity at each internal node. This function basically implements the method of Mahler et al. (2010) in which we first reconstructed historical biogeography of Greater Antillean Anolis - and then we estimated the standing 'island-wise' lineage density at each node, integrating over the islands on which the node might have been found.

Our method for doing this is relatively simple. We just reconstructed ancestral states first at each node, and then along each edge at the height of the node; and then we just added the probabilities from the latter & multiplied them by the probabilities of the former. So, for instance, if a given target node had a (empirical Bayesian) posterior probability of being on Puerto Rico of 0.5, and Hispaniola of 0.5; and a hypothetical competing lineage was on Puerto Rico with probability 0.5 & Hispaniola with probability 0.5 (for convenience of illustration), then our point estimate of the number of competing lineages for the first node is:

Pt(PR)×Pc(PR)+Pt(H)×Pc(H)
=0.5 × 0.5 + 0.5 × 0.5
=0.5

in which subscripts t & c are target & competitor, respectively.

This makes perfect sense because the following four scenarios are expected with equal probability: (PRt , PRc), (PRt , Hc), (Ht , PRc), and (Ht , Hc) - and exactly 1/2 of the time our target node arises with one competitor. The same logic extends to multiple competing lineages, probabilities different from 0.5, & more than two islands.

The only identified issue with prior versions of estDiversity is that I had been using scaled conditional likelihoods for Pt instead of marginal reconstructed ancestral states; whereas for Pc I was (properly) using marginal reconstructions. (For more information on the distinction, search my blog.) I've realized that this was not right for some time, but had not heard any interest in the function so I hadn't gotten around to fixing it.

In addition to this, though, the new version of the function also gives the option of using stochastic maps to compute ancestral lineage density directly. It does this just by performing stochastic mapping using make.simmap, and then - at each internal node - counting the number of lineages at the height of the node with the same state as the node. For each stochastic map, each time a new node coexists with a competitor from mapped to the same island, we add 1/nsim. Otherwise, we add nothing.

We should probably actually prefer to this because this will account for the possibility (virtually guaranteed when nodes are close to each other in the tree) that the probabilities at a node and along competing edges are not independent.

Both methods are really slow, unfortunately. They seem to yield similar results:

> d.asr<-estDiversity(tree,x)
Please wait. . . . Warning - this may take a while!
Completed 10 nodes
Completed 20 nodes
Completed 30 nodes
Completed 40 nodes
> d.asr
       48         49         50         51         52
 0.0000000  0.8721167  1.8606261  3.2793402  4.7093087
        53         54         55         56         57
15.0590177  6.5464430  9.5738490 11.7358135  0.2020746
        58         59         60         61         62
 1.0892816  2.0400146  3.0361920  3.6605135  0.4269534
        63         64        ...
 1.2145138        ...
> d.maps<-estDiversity(tree,x,method="simulation")
Please wait. . . . Warning - this may take a while!
Completed 10 nodes
Completed 20 nodes
Completed 30 nodes
Completed 40 nodes
> > d.maps
   48    49    50    51    52    53    54    55    56    57
 0.00  0.99  2.67  3.64  6.28 16.08  9.10 12.02 14.04  0.22
   58    59    60    61    62    63    64    65   ...
 1.03  2.03  3.03  4.20  0.39  1.19  2.19   ...
> plot(d.asr,d.maps)

This new version depends on a number of other updates, so to test it (and please do!), I recommend downloading the newest phytools build (phytools 0.2-47), rather than trying to run the function from source.

New version of reroot

I just posted a new version of the function reroot, which I've moved to the source file utilities.R. The main different between reroot and the 'ape' function root is that reroot allows the user to root the tree along any internal or terminal edge, rather than just at nodes.

The previous version of this function had two problems: (1) it behaved incorrectly along edges arising from the root node of the tree; and (2) it depended on root(...,node=xx) which seems to act weird under some conditions & may have a bug. The new version of this function works totally differently. It still uses root - but with root(...,outgroup="XX") instead of using option node. This seems to fix the problems in the prior version. Instead, it uses the phytools functions splitTree to split the tree at the new root position, and then it reroots the basal subtree (i.e., the subtree rootward of the split point) at the tip, and then attaches the two subtrees together at this new root using the phytools function paste.tree.

Just for interest, here's a quick step-by-step demo of the process:

> require(phytools)
Loading required package: phytools
> # simulate tree
> tree<-rtree(n=10); tree$edge.length<-rep(1,nrow(tree$edge))
> plotTree(tree,node.numbers=T)
> # let's re-root halfway along the branch ending in 18
> node.number<-18
> position=0.5*tree$edge.length[which(tree$edge[,2]==18)]
> # split the tree
> tt<-splitTree(tree,list(node=node.number,bp=position))
> plot(tt,no.margin=TRUE,root.edge=TRUE)

Note that the top & bottom trees have a different scale - I show them for illustration of the split only.

> p<-tt[[1]]; d<-tt[[2]]
> # re-root the rootward subtree
> p<-root(p,outgroup="NA",resolve.root=T)
> # adjust branch lengths so that all the edge length
> # leading to "NA" is moved to the other side of the root
> bb<-which(p$tip.label=="NA")
> ee<-p$edge.length[which(p$edge[,2]==bb)]
> p$edge.length[which(p$edge[,2]==bb)]<-0
> cc<-p$edge[which(p$edge[,2]==bb),1]
> dd<-setdiff(p$edge[which(p$edge[,1]==cc),2],bb)
> p$edge.length[which(p$edge[,2]==dd)]<- p$edge.length[which(p$edge[,2]==dd)]+ee
> plot(p,no.margin=TRUE,root.edge=TRUE)
> plot(d,no.margin=TRUE,root.edge=TRUE)
> # re-attach
> tt<-paste.tree(p,d)
> plotTree(tt)

That's it.

Critical fix for make.simmap

I just identified a critical error in make.simmap that I introduced when I allowed make.simmap to accept uncertain tip states. The priors on our tip states are treated as conditional likelihoods during node sampling following Bollback (2006) and consequently I just put these probabilities in the 1 through Nth element of the matrix of conditional likelihoods from the pruning algorithm. Unfortunately, in an internally called function that assigns node states I neglected to update:

NN[which(tree$edge[,1]==root),1]<- rstate(L[1,]*pi/sum(L[1,]*pi))
which assumes that the root node is in row 1 of L (as it was, through phytools 0.2-33), to:
NN[which(tree$edge[,1]==root),1]<- rstate(L[as.character(root),]*pi/sum(L[as.character(root),]*pi))

Source code for the fixed version of make.simmap is here, but I will post a new phytools version shortly & this fix will be in the next CRAN release.

Tuesday, April 16, 2013

CI on LTT plot from a sample of trees

Today, someone posted the following query to R-sig-phylo:

Does anyone know of a good implementation of an LTT plot that can draw a Confidence Interval or HPD interval from a set of trees? I've seen things like `ltt` in phytools that can draw one line for each tree in the sample. However, this can look a bit messy, and I'd ideally love to just plot the 95% CI or HPD of the ages/lineages in the trees. Has anyone seen anything like this?

Dave Bapst promptly responded that there is a function in his paleotree that can do this. For example:

> require(phytools)
Loading required package: phytools
> require(paleotree)
Loading required package: paleotree
> trees<-pbtree(n=50,t=log(50)-log(2),method="direct", nsim=200,quiet=T)
> multiDiv(trees,(log(50)-log(2))/100,plotLogRich=TRUE)

This is pretty cool.

It occurred to me that there are two different CIs that we might be interested in: the CI(lineages), given a time in the past; or the CI(time) given a number of lineages. The former, CI(n|t), can be read as the (say) 95% CI of the number of lineages alive at time t; whereas the latter, CI(t|n), is the 95% CI on the timing of the nth speciation event.

Even before Dave responded, especially because phytools was mentioned in the query, I'd already started working on this. Here's a link to a function that does this, and also computes the mean (rather than median), and returns the result invisibly. So, for instance:

trees<-pbtree(n=50,t=log(50)-log(2),method="direct",nsim=200,quiet=T)
> # same as paleotree
> XX<-ltt95(trees,log=TRUE)
> # here is the object returned
> XX
            time low(lineages) lineages high(lineages)
 [1,] 0.00000000             1      1.0              1
 [2,] 0.03218876             2      2.0              3
 [3,] 0.06437752             2      2.0              3
 [4,] 0.09656627             2      2.0              3
 [5,] 0.12875503             2      2.0              4
 [6,] 0.16094379             2      2.0              4
 [7,] 0.19313255           ...

Now on time with the mode changed to "mean":

> # now on time + mode="mean"
> ltt95(trees,log=TRUE,method="times",mode="mean")

It also works for trees with varying total length or number of tips (although in the latter case, only for method="lineages". So, for instance:

> treesN<-pbtree(n=50,nsim=200)
> ltt95(treesN,log=TRUE,method="lineages",mode="mean")

Or:
> treesT<-pbtree(t=log(50)-log(2),nsim=200)
> ltt95(treesT,log=TRUE,method="lineages",mode="mean")

Finally, we can set an arbitrary α level. For instance:

> XX<-ltt95(trees,alpha=0.1,mode="mean",log=FALSE)

Basically, you get the idea. Please note that the version of pbtree that I'm using in the above simulations is in a non-CRAN phytools update (phytools 0.2-46).

Sunday, April 14, 2013

Simulating trees conditioned on taxa & time with 'direct' sampling

The day before yesterday I posted a new version of pbtree that could simulate first pure-birth & then birth-death phylogenies conditioned on both the total number of tips & the total time via rejection sampling. That is, it simulates trees for total time t and then rejects any phylogeny that doesn't have the correct number of tips, N.

Well, as I was out walking & eating a cookie today, it suddenly occurred to me how we might sample birth-death trees conditioned on both N & t 'directly' (rather than via rejection). It would be by the following two step procedure:

1. Simulate a set of wait-times to total time t. For each wait time, we also need to compute a birth or death event and keep count of the births minus the deaths (m) so that we can draw our exponential waiting times with λ = m × (b + d). Repeat until the number of lineages, m, at t is equal to N.

2. With this set of waiting-times & birth or death events in hand, simulate the tree.

By simulating the waiting-times first, followed by the tree, we know before we start that our tree will be of length t with N taxa. This should reduce computation time dramatically.

I've posted an experimental version of this here. The following is a demo:

> source("pbtree.R")
> tt<-log(100)-log(2)
> system.time(tree1<-pbtree(b=1.2,d=0.2,n=100,t=tt))
simulating with both taxa-stop (n) and time-stop (t) is
performed via rejection sampling & may be slow

  114 trees rejected before finding a tree

   user  system elapsed
   3.88    0.00    3.88
> length(getExtant(tree1))
[1] 100
> max(nodeHeights(tree1))
[1] 3.912023
>
> system.time(tree2<-pbtree(b=1.2,d=0.2,n=100,t=tt, method="direct"))
simulating with both taxa-stop (n) & time-stop (t) using
'direct' sampling. this is experimental
   user  system elapsed
   0.13    0.00    0.12
> length(getExtant(tree2))
[1] 100
> max(nodeHeights(tree2))
[1] 3.912023

We can also do somethings that are just impossible with rejection sampling - for instance, simulating with a very high extinction rate, e.g.:

> system.time(tree3<-pbtree(b=4,d=3,n=100,t=tt, method="direct"))
simulating with both taxa-stop (n) & time-stop (t) using
'direct' sampling. this is experimental
   user  system elapsed
  10.30    0.00   10.31
> tree3

Phylogenetic tree with 365 tips and 364 internal nodes.

Tip labels:
        t1, t2, t3, t12, t53, t56, ...

Rooted; includes branch lengths.
> length(getExtant(tree3))
[1] 100
> max(nodeHeights(tree3))
[1] 3.912023
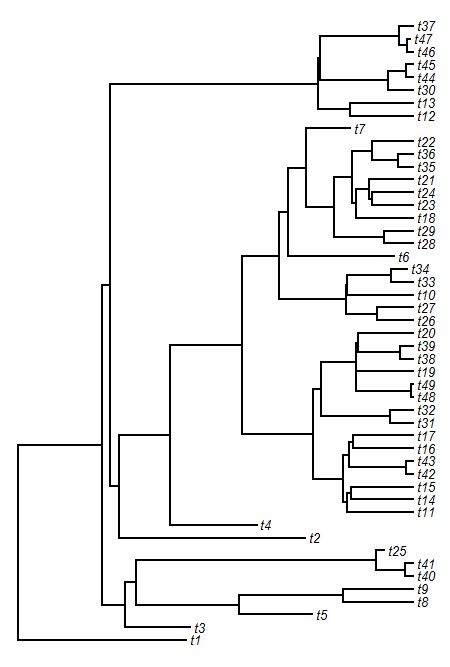
> plotTree(tree,ftype="off",lwd=1)

This isn't without its limits, of course - but we could never do this via rejection sampling. Neat.

New version of tree simulator with death (as well as birth)

As described in a couple of earlier posts (1, 2) I have been doing some work on the function pbtree which does pure-birth (i.e., Yule process) phylogeny simulations.

Well, as the title of this post would suggest, the function can now do birth-death simulation, as well as pure-birth. Remember, pbtree can now condition on total time, the number of tips, or both (by rejection sampling); and can simulate in continuous or discrete time.

Simulating with death (i.e., extinction) is not too hard. For continuous time simulation, whereas before we drew our waiting times from the exponential distribution with λ = b × m for birth-rate b & number of 'open' lineages m, with extinction we draw our wait times from the exponential distribution with λ = (b + d) × m. This is because if the wait time to an event of class A is exponentially distributed with rate λA & the wait time to an event of class B is exponentially distributed with rate λB, and A & B are independent, then the wait times to A or B are exponentially distributed with λ = λA + λB. The probabilities that an event is a birth or a death given that it has occurred are just b/(b+d) and d/(b+d), respectively. This means that our procedure for growing the tree should be (1) draw a random wait time; (2) pick a lineage at random; and (3) and then have it speciate or die with the probabilities given above.

For discrete time the procedure is only slightly different. Now we draw a random wait time from the geometric distribution with p = b + d.** (**Remember that we are actually drawing m independent waiting times & then using the one or more smallest times.) However, since p is a probability (whereas λ was a rate), we are now constrained such that b + d ≤ 1.0. This is because a given lineage can speciate, go extinct, or do nothing within a time-step - but it can't do more than one of these. (b + d = 1.0 guarantees that an event of some kind - speciation or extinction - occurs in every lineage in every generation.)

Code for the new version of pbtree is here. There is also a new phytools build (phytools 0.2-44) with these updates, and it can be downloaded & installed from source.

Here's a little demo of the function, using continuous time simulations:

> require(phytools)
Loading required package: phytools
> packageVersion("phytools")
[1] ‘0.2.44’
> # continuous time, taxa stop
> tree<-pbtree(d=0.2,n=50)
> plotTree(tree,fsize=0.8,ftype="i")
> tree<-pbtree(d=0.2,n=50)
> plotTree(tree,fsize=0.8,ftype="i")
> # continuous time, time stop
> tt<-log(50)-log(2); tt
[1] 3.218876
> tree<-pbtree(b=1.2,d=0.2,t=tt)
> plotTree(tree,fsize=0.8,ftype="i")
> max(nodeHeights(tree))
[1] 3.218876
> # retain only extant lineages
> tree<-pbtree(d=0.5,n=100,extant.only=TRUE)
> plotTree(tree,ftype="off")
> ltt(tree,plot=FALSE)$gamma # pull of the recent
[1] 2.298986
> # continuous time, taxa & time stop
> tt # time for simulation
[1] 3.218876
> tree<-pbtree(b=1.2,d=0.2,n=50,t=tt)
simulating with both taxa-stop (n) and time-stop (t) is
performed via rejection sampling & may be slow

  13 trees rejected before finding a tree

> max(nodeHeights(tree))
[1] 3.218876
> length(getExtant(tree))
[1] 50
> plotTree(tree,fsize=0.8,ftype="i")
> # multiple trees, time stop
> # function to get the number of extant tips
> ff<-function(x){
  tol<-1e-12
  if(max(nodeHeights(x))<(tt-tol)) 0
  else length(getExtant(x))
 }
> # low extinction rate
> lowD<-pbtree(b=1.1,d=0.1,t=tt,nsim=1000)
> lowD
1000 phylogenetic trees
> NlD<-sapply(lowD,ff)
> mean(NlD)
[1] 48.283
> var(NlD)
[1] 1360.986
> # high extinction rate
> highD<-pbtree(b=1.5,d=0.5,t=tt,nsim=1000)
> highD
1000 phylogenetic trees
> NhD<-sapply(highD,ff)
> mean(NhD)
[1] 48.681
> var(NhD)
[1] 2321.631
> # distribution of tree sizes
> hist(NlD,0:ceiling(max(c(NlD,NhD))/10)*10,col="grey", xlab="frequency",ylab="number of tips",main=NULL)
> hist(NhD,0:ceiling(max(c(NlD,NhD))/10)*10,col="grey", xlab="frequency",ylab="number of tips",main=NULL)

Pretty cool. The purpose of the final exercise was just to illustrate that although the expected number of lineages at time t can be computed as N = e(b-d)×t, the variance among simulations goes up with increasing b.

That's it. I've been testing out the new pbtree extensively - but please report if you are able to break it! Thanks!

Friday, April 12, 2013

Discrete- & continuous-time phylogeny simulation

Earlier today I posted a new version of the phytools pure-birth tree simulator: pbtree. This version is neat because it allows you to condition on the total number of tips in the tree, the total time, or (via rejection sampling) both.

However, when I started looking at pbtree it was actually because I wanted to add in discrete-time simulations, in addition to the continuous-time tree simulations already available in pbtree. (There is at least some interest in this.) Unlike discrete-time continuous character simulations, such as in the visualization tool bmPlot, simulating trees under a discrete-time model is not the same as simulating every time-step from 0 to the total time of the simulation. Rather, it just means we draw our waiting times between speciation events from a different probability distribution.

For continuous-time simulations we draw waiting times from an exponential distribution in which the rate parameter, λ, is equal to the speciation rate × the number of "open" edges at the last event. For discrete-time simulations, we draw waiting times from the discrete analog - the geometric distribution - which describes the probability that the first success in a series of Bernoulli trials occurs in trial x. Since the outcome of a discrete-time speciation process can be viewed as a Bernoulli trial (i.e., a lineage speciates, or it does not, in every time-step), this is the correct distribution of waiting times under our model.

There is a little wrinkle, here, though. Do you recall that to get the next wait time given m open edges we simulated rexp(n=1,lambda=b*m)? Well, in discrete-time the analogy is imperfect. What we need to do instead is simulate rgeom(n=m,prob=b) and then the wait-time to the next even is the minimum of that. Why? This is because we can think about the m open lineages as m different series of Bernoulli trials, and we want to find the wait time to the next event on any lineage in the tree.

In addition, we have to allow for the possibility that there are multiple speciation events within a single time-step - as long as all take place on different branches. To do this, we need to get the set of minimal rgeom(n=m,prob=b), rather than just a single minimum.

Now that we have a waiting time or set of (equal) waiting times, we just add a new node to any of the "open" edges in the tree, all with equal probability. We do that until we reach n or t. For discrete-time we sometimes have a problem when our stop criterion is the number of tips, not time. This is that sometimes multiple speciation events will occur within a timestep. The current version of the function allows this and spits a warning if the number of tips in the simulated tree are different from the stopping criterion.

The code for this updated version of pbtree is here; however since it uses an internal phytools function, to try it out you should install the latest version of phytools from source (phytools 0.2-43). Here's a quick demo:

> require(phytools)
Loading required package: phytools
> packageVersion("phytools")
[1] ‘0.2.43’
>
> ## this is our speciation prob to get 100 tips after
> ## 1000 time-steps, on average in discrete time
> b<-exp((log(100)-log(2))/1000)-1
>
> # simulate
> trees<-pbtree(b=b,t=1000,type="discrete",nsim=2000)
> N<-sapply(trees,function(x) length(x$tip.label))
> mean(N)
[1] 98.7815
> var(N)
[1] 4848.484
> range(N)
[1] 3 595
> hist(N,0:24*25,col="grey",xlab="frequency",ylab="number of tips",main=NULL)

As before, we can also condition on both N and t; however, since this is done via rejection sampling, it is probably wise (at least for illustrative purposes here) to choose a reasonable combination of b, n, and t. For instance:

> # use our speciation probability from before
> tree<-pbtree(b=b,n=100,t=1000,type="discrete")
simulating with both taxa-stop (n) and time-stop (t) is
performed via rejection sampling & may be slow

  41 trees rejected before finding a tree

> plotTree(tree,ftype="off")

Cool. That's it for now.