Friday, May 31, 2013

New CRAN version of phytools

There is a new version of phytools (phytools 0.2-80) now available on CRAN. It will probably take a few days for the Mac OS & Windows binaries to be compiled and to percolate through the mirror repositories.

Relative to the most recent CRAN build of phytools (phytools 0.2-70), this version has only a couple of significant updates, as follows:

1. A bug fix in make.simmap(..., type="mcmc"), described here.

2. The addition of the option to plot trees in a circular (type="fan") style to plotSimmap, plotTree, contMap, and densityMap (described here: 1, 2, 3, 4, 5, 6, 7, and 8).

Check it out.

Thursday, May 30, 2013

Bug fix in make.simmap(...,Q="mcmc")

I just posted a new version of make.simmap and a new phytools build (phytools 0.2-77). This version fixes a bug affecting make.simmap(...,Q="mcmc"). In this method, the transition matrix Q is sampled from its Bayesian posterior probability distribution using MCMC given the model & data. This sample is then used by make.simmap to map characters on the tree.

The bug was not in the MCMC itself which (so far as I can tell) is properly designed, but in how Q was stored in sampling generations - specifically, the updated value of Q for that generation was always stored. The reason this is not a bug in the MCMC is because this value was only returned to the chain with probability equal to the posterior odds ratio - thus this is only about the value that is stored from the chain, not the behavior of the chain itself. This was somewhat difficult to detect because it will not be obvious unless the variance on the proposal distribution is high relative to the curvature of the likelihood surface or the prior density. (In case it's not obvious why this is, this is because if the proposal variance is low - most post burn-in samples will have relatively high posterior odds and will thus have a good chance of being accepted; whereas if the proposal variance is high, most samples will have low posterior odds.)

I also changed the starting value of Q for the MCMC. Previously, I had arbitrarily set all the non-diagonal elements of Q to a fixed constant. Now I draw a set of values at random from the prior probability density on Q, as provided by the user. The advantage of this is because if we set a very strong prior on Q, our MCMC may have difficulty converging on the region of high posterior density if the variance on our proposal distribution is too low or (especially) high.

I'm not sure what a good proposal variance is - but one way of thinking about it is relative to the empirical Q. For instance, if the non-diagonal of our empirical Q are all around ~0.1, then it is probably not a good idea to vQ = 10. Unless our data contain very little information about Q, almost all samples will be rejected and the MCMC will be very inefficient at exploring the posterior distribution of Q. Conversely, if the non-diagonal of our empirical Q average > 100, then we should probably not choose vQ = 0.001. In this case, if we start anywhere near the ML of Q - and unless we have very little information about Q in our data - almost all samples will be accepted, which is also a bad way to sample from the posterior using MCMC.

Even though make.simmap is not set up for this, it is possible to do some diagnoses on our MCMC using the MCMC diagnostics package coda. For example, let's say we have obtained 100 samples of Q (and thus 100 stochastic mapped trees) from the posterior after burnin

mtrees<-make.simmap(tree,x,Q="mcmc",vQ=0.01,prior= list(use.empirical=TRUE,beta=2))
we can get the likelihoods using
logL<-sapply(unclass(mtrees),function(x) x$logL)
or (for instance), the posterior sample of Q1,2 using
q12<-sapply(unclass(mtrees),function(x) x$Q[1,2])
and then perform diagnostics (effective size, rejection rate, etc.) using the appropriate coda functions. To increase effective size without increasing the number of sampled trees, we can increase the sample frequency (samplefreq) and increase or decrease the proposal variance (vQ).

Monday, May 27, 2013

Circular trees in densityMap and contMap

In an earlier post I showed how plotSimmap(...,type="fan") could be used to plot densityMap or contMap style plots using the object of class "densityMap" or "contMap" returned invisibly by each function, respectively.

Well, I have now build this directly into contMap & densityMap (and the S3 generic plot for objects of class "densityMap" and "contMap"). Check it out:

> require(phytools)
Loading required package: phytools
> packageVersion("phytools")
[1] ‘0.2.76’
> contMap(tree,x,type="fan",fsize=0.9)
> X<-densityMap(mtrees,outline=TRUE,fsize=0.9)
sorry - this might take a while; please be patient

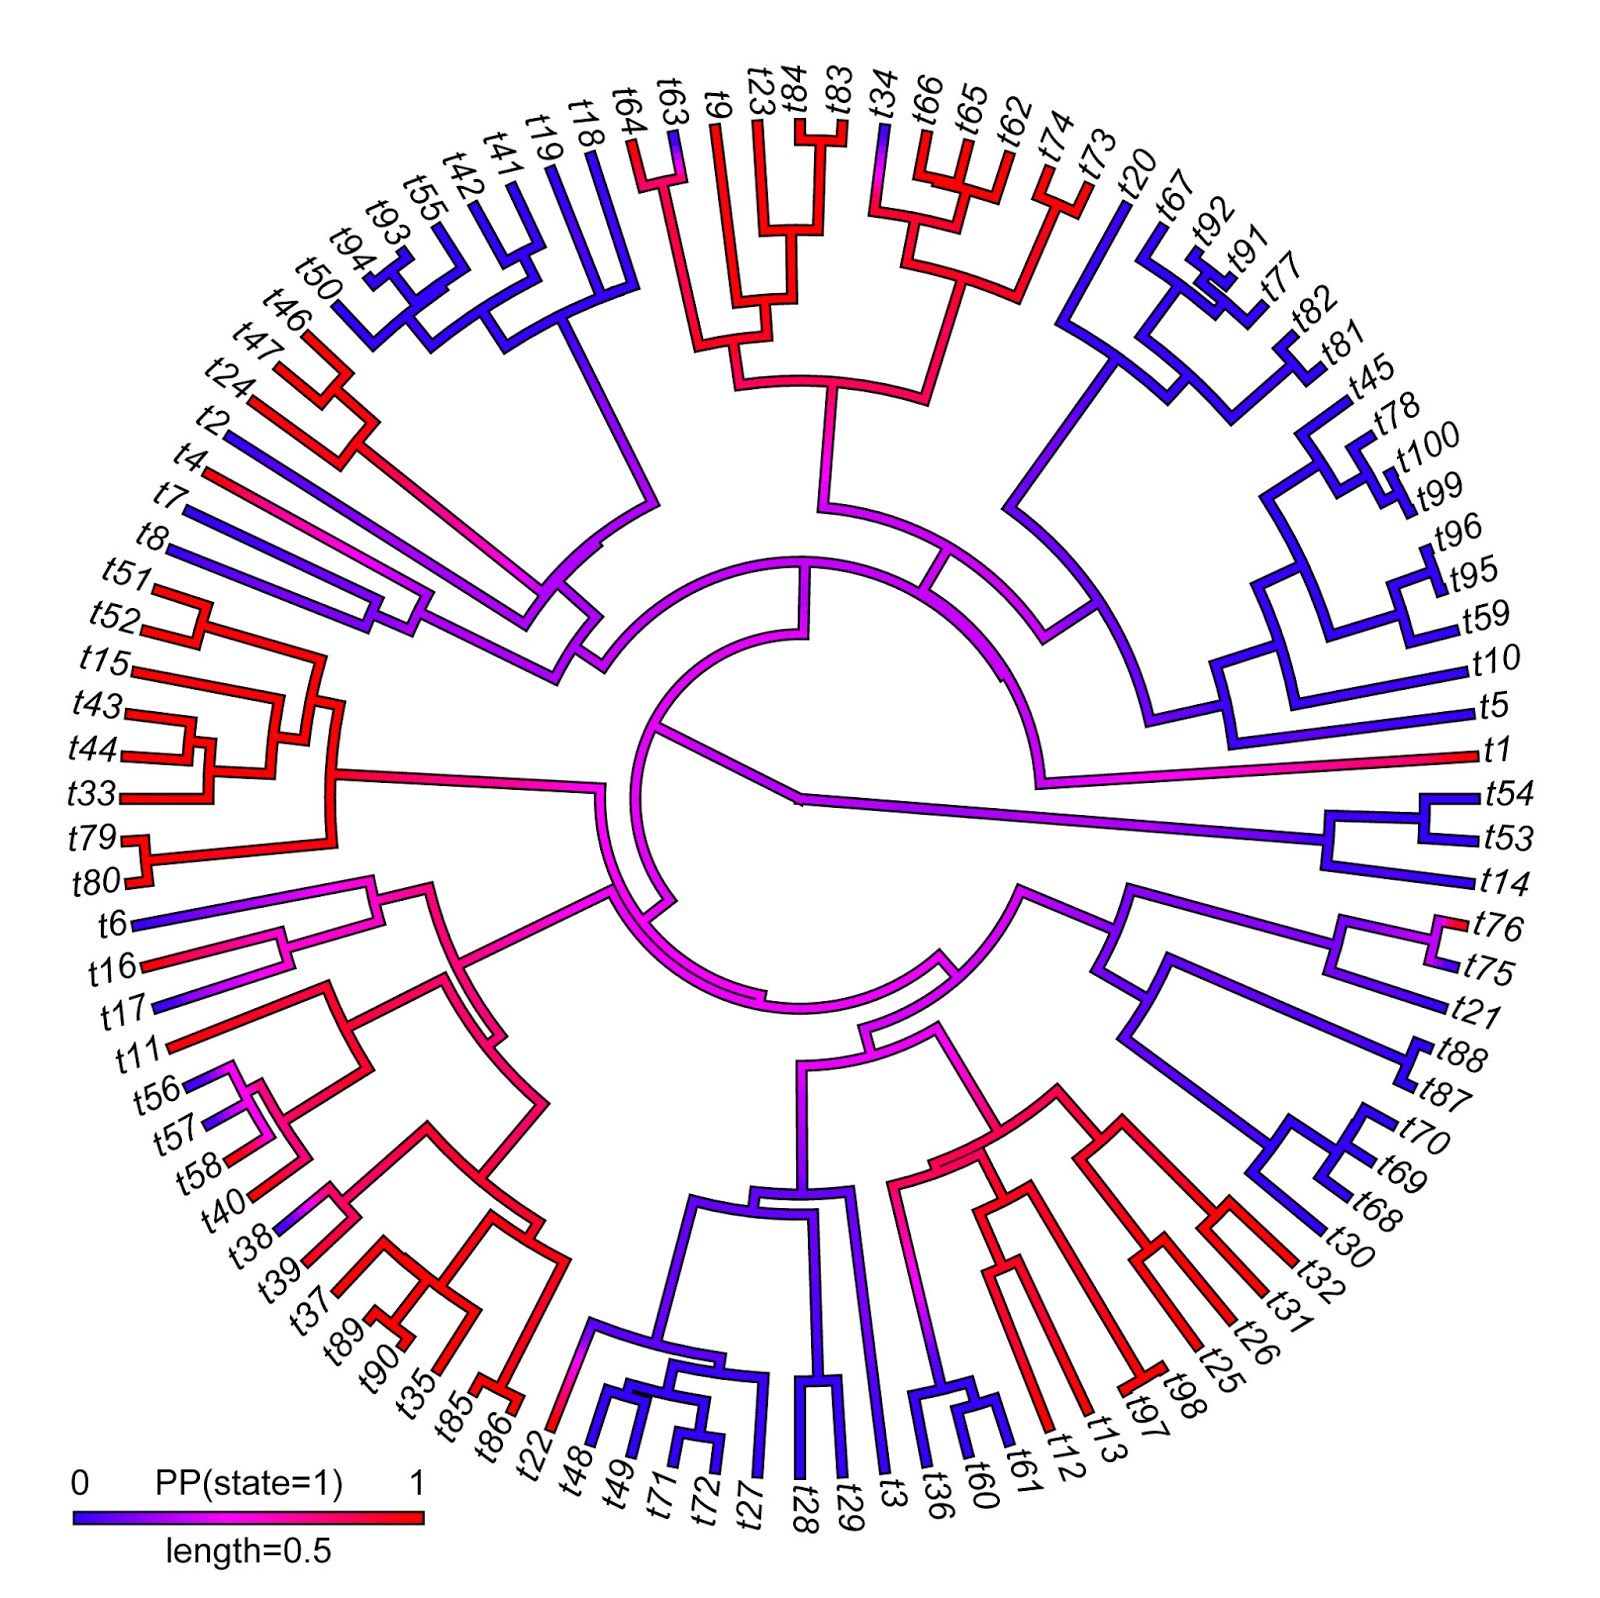
Argh - way too cluttered. Let's try a circular tree instead!

> class(X)
[1] "densityMap"
> plot(X,type="fan",fsize=0.9,outline=TRUE)

Since these updates involved changes to a number of methods in phytools - the best bet is to update to the latest non-CRAN phytools build (phytools 0.2-76).

That's it.

Sunday, May 26, 2013

Minor fixes to plotSimmap

I just fixed a couple of very minor issues with plotSimmap(...,type="fan"): specifically, lwd was not properly controlling the line width of edges; and ftype="off" (which should turn the labels off) was not working. The fixed function version of is here, along with a new minor phytools build (phytools 0.2-75).

We might want to turn off the labels if we have, for instance, a very large tree:

Click for larger version.

That's it for now.

Saturday, May 25, 2013

Some minor improvements to plotSimmap(...,type="fan") and a few other updates

I just posted a new version of plotSimmap and a new minor phytools version (phytools 0.2-74). The updates mainly do the following: (1) allows user control over close to the full range of plotting options in from plotSimmap(..., type="phylogram"); (2) change the shape of the line caps from round to square (to bring into alignment with plotSimmap(...,type="phylogram") and common sense); (3) improve the alignment of labels with the terminal edge their offset from the tips; and, finally, (4) fix some problems where not enough space was left around the plotted trees to allow the labels to be added (this also seems to affect plot.phylo(...,type="fan")).

The result looks very nice. Here's a quick demo using the phylogeny of 100 Greater Antillean anoles from Mahler et al. (2010) and a stochastic mapping of "ecomorph class" (including non-ecomorph species) on the tree. leg gives the color→ecomorph translation.

> require(phytools)
Loading required package: phytools
> packageVersion("phytools")
[1] ‘0.2.74’
> data(anoletree) # load tree
> states<-sort(unique(getStates(anoletree))) # get states
> # set color legend
> leg<-setNames(palette()[1:7],c(states[3],states[-3]))
> leg
Non-    CG    GB       TC     TG     Tr        TW
"black" "red" "green3" "blue" "cyan" "magenta" "yellow"
> # ok - here is a trick to plot an outline around the tree
> par(col="white")
> plotTree(anoletree,type="fan",lwd=4,mar=rep(0,4), fsize=0.8)

Note: type="fan" is in development.
Many options of type="phylogram" are not yet available.

> par(col="black")
> plotSimmap(anoletree,leg,type="fan",lwd=2,mar=rep(0,4), add=TRUE,fsize=0.8)

Note: type="fan" is in development.
Many options of type="phylogram" are not yet available.


(Click for highest resolution.)

Cool.

I also now allow type="fan" trees to be plotted from plotTree, which uses plotSimmap internally.

Friday, May 24, 2013

Raster image files from circular trees in R

There is some noticeable aliasing in circular (type="fan") trees exported directly from R in a raster format such as .png or .jpg. This can be overcome by exporting instead in a lossless vector format such as .pdf or .eps.

For example, here is a circular contMap style tree exported from R as a .png:

(Click for highest resolution version.)

Whereas here is the same tree exported as a .pdf, then read into Illustrator & exported as a much higher quality .jpg (a raster graphic format):

(Click for highest resolution version.)

Creating a type="fan" densityMap or contMap plot

I have not yet added the "type" argument to functions densityMap or contMap; however it is already possible to create a circular densityMap or contMap style tree. Here's how:

> require(phytools)
Loading required package: phytools
> packageVersion("phytools")
[1] ‘0.2.71’
> # simulate tree & data
> tree<-pbtree(n=100,scale=1)
> x<-fastBM(tree)
> # first plot typical contMap & obtain "contMap" object
> XX<-contMap(tree,x) # we don't care about this one
> # now plot with type="fan"
> plotSimmap(XX$tree,XX$cols,type="fan")
Note: type='fan' is in development. Most options not yet available.
> # finally, add color bar
> # (we have to click where we want this)
> add.color.bar(0.8,cols=XX$cols,title="trait value", lims=range(x),digits=2)

Note that we have to click where we want to put the color bar/legend.

That's it.