Wednesday, December 7, 2016

Custom color palettes in plotBranchbyTrait

I recently received the following user request:

“I have a small question regarding your phytools function plotBranchbyTrait that I was hoping you perhaps could help with. I am trying to visualize [my data with range 0 to 1] using the heat.color palette. However, as some species have a proportion of 0, and others have a proportion of 1, the branches leading to the latter are almost white and thus impossible to see. If I change the proportion of one of these species to, say 1.2, most of branches become more visible (except the branch leading to that particular species of course). However, this is not an ideal way to go about it. Is there any way I can make sure to only use parts of the color palette for the plot, excluding the brightest, white colors?”

Indeed, this effect can easily be verified using simulation:

library(phytools)
tree<-pbtree(n=100)
x<-fastBM(tree,scale=1)
plotBranchbyTrait(tree,x,"tips","heat.colors",show.tip.label=FALSE)

plot of chunk unnamed-chunk-1

We can see that tips & edges with the most extreme values of the trait essentially vanish.

[Note that plotBranchbyTrait is unusual among phytools functions in that it uses ape::plot.phylo internally instead of plotSimmap in my package - hence the argument show.tip.label=FALSE which would be ftype="off" in most other phytools functions.]

The easiest way to address this was to allow the argument palette to be supplied as a function as well as as a string. I pushed this update to GitHub already & it can be seen here.

Here's an example:

plotBranchbyTrait(tree,x,"tips",
    palette=colorRampPalette(c("red","orange","yellow")),
    show.tip.label=FALSE)

plot of chunk unnamed-chunk-2

We can even write our own custom function, for instance using the original heat.colors palette function internally, but cutting off the last (say) 5% of the spectrum:

foo<-function(n){
    obj<-heat.colors(round(1.05*n))
    obj[1:n]
}
plotBranchbyTrait(tree,x,"tips",palette=foo,show.tip.label=FALSE)

plot of chunk unnamed-chunk-3

Finally, because plotBranchbyTrait uses plot.phylo internally, we can use any of the plot.phylo options, such as:

plotBranchbyTrait(tree,x,"tips",foo,type="fan",show.tip.label=FALSE,
    legend=1.8)

plot of chunk unnamed-chunk-4

plotBranchbyTrait(tree,x,"tips",foo,type="unrooted",show.tip.label=FALSE,
    legend=1.8)

plot of chunk unnamed-chunk-4

and so on.

To get this update you can install phytools from GitHub using the package 'devtools' as follows:

library(devtools)
install_github("liamrevell/phytools")

Tuesday, December 6, 2016

Updated phytools is now on CRAN

phytools 0.5-64 is now available from CRAN.

install.packages("phytools",repos="https://cloud.r-project.org")
## Installing package into 'C:/../R/win-library/3.3'
## (as 'lib' is unspecified)
## package 'phytools' successfully unpacked and MD5 sums checked
packageVersion("phytools")
## [1] '0.5.64'

[As of about 7am, December 6 it looks like Windows binaries have been built, but not binaries for Mac OS. Consequently, Mac users may want to hold off updating or install from source. Installing phytools from source is super-easy as phytools does not require compilation. Just add the argument type="source" to install.packages & voila!]

Saturday, December 3, 2016

New phytools version (>=0.5-62) on its way to CRAN

In advance of a workshop I'll be teaching next week at the Universidad Nacional del Comahue in (reputedly) beautiful Bariloche, Argentina, I will be trying to get a new version of phytools on CRAN. This update will have version number >=0.5.62 (TBD).

It has been over five months since I last submitted a phytools update to CRAN. Obviously, there have been a ton of updates in that time. Here are some:

  1. A bug fix in collapseTree.
  2. More user control of the plot method for phylo.toBackbone (here).
  3. Another update to backbonePhylo to permit multiple clades to have the same label.
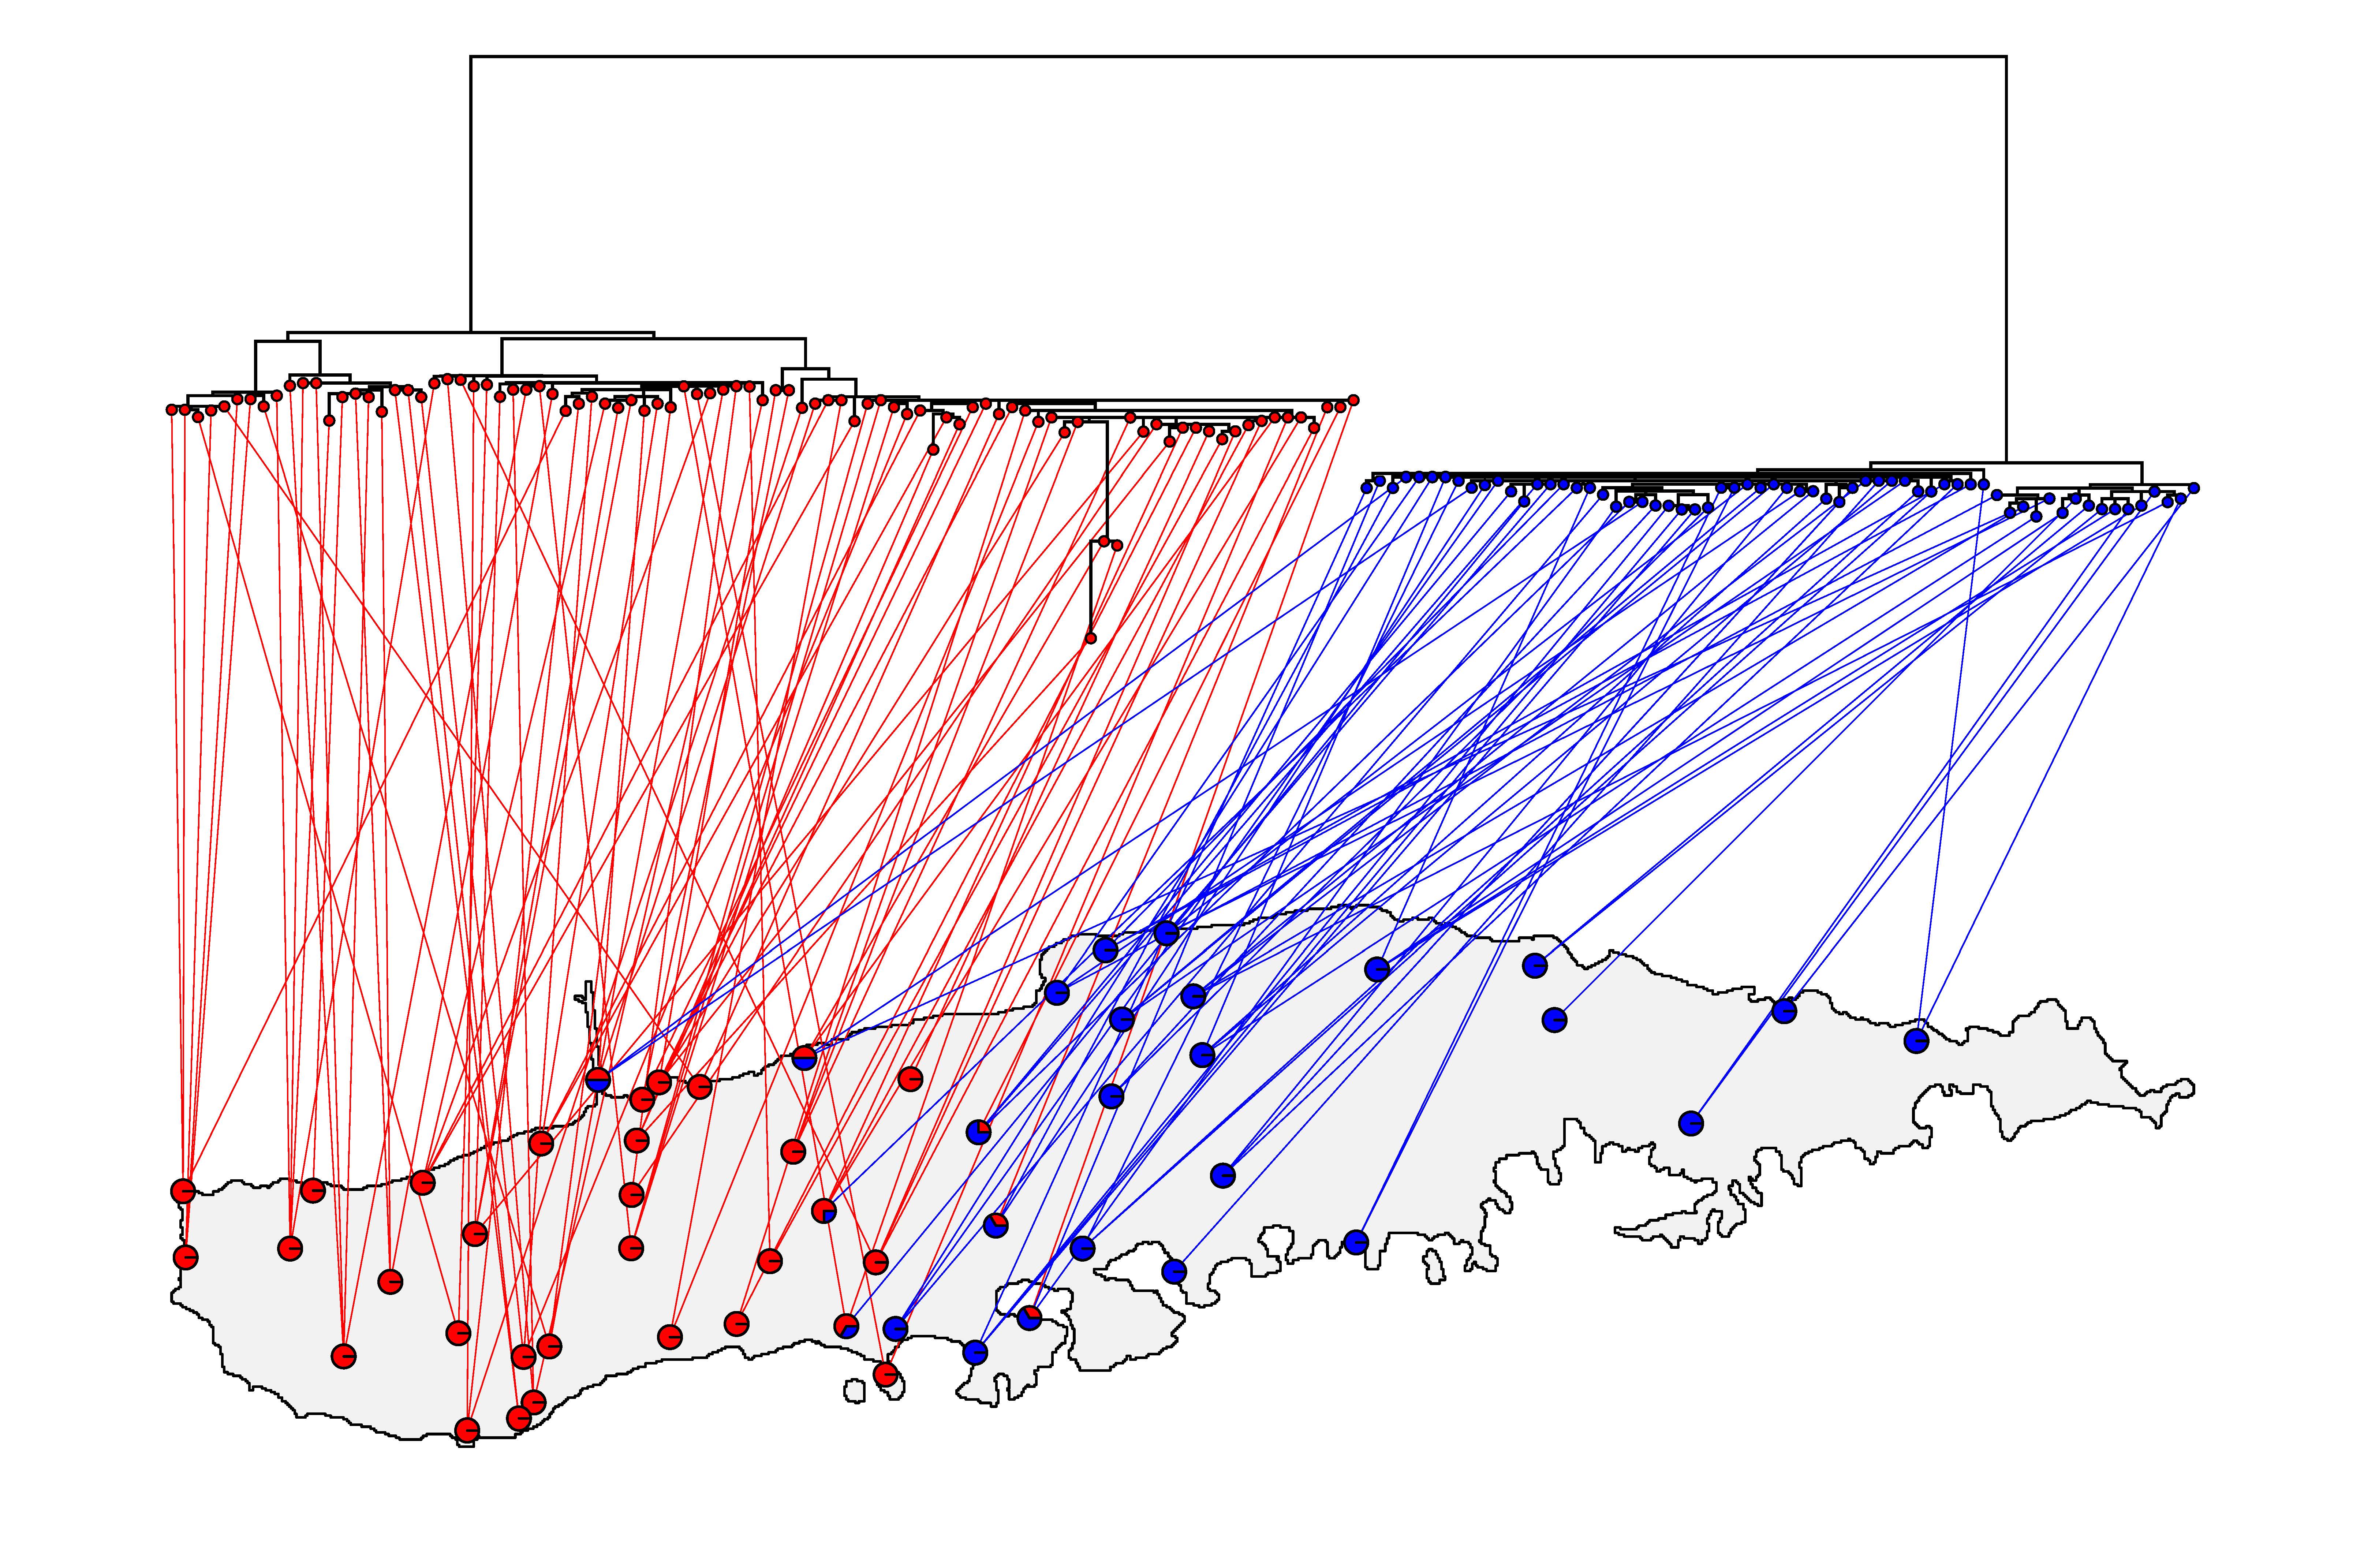
  4. Various updates to phylo.to.map which helped enable this nice plot:
  5. A new phytools function for showing a barplot next to a plotted tree, plotTree.barplot (1, 2, 3).
  6. A new function, related to plotTree.barplot, to plot a boxplot next to a phylogeny (plotTree.boxplot). Also see this addition permitting the boxplot to be build using the ‘formula’ method.
  7. A simple update to phyl.pca to permit more columns than rows in the input data matrix.
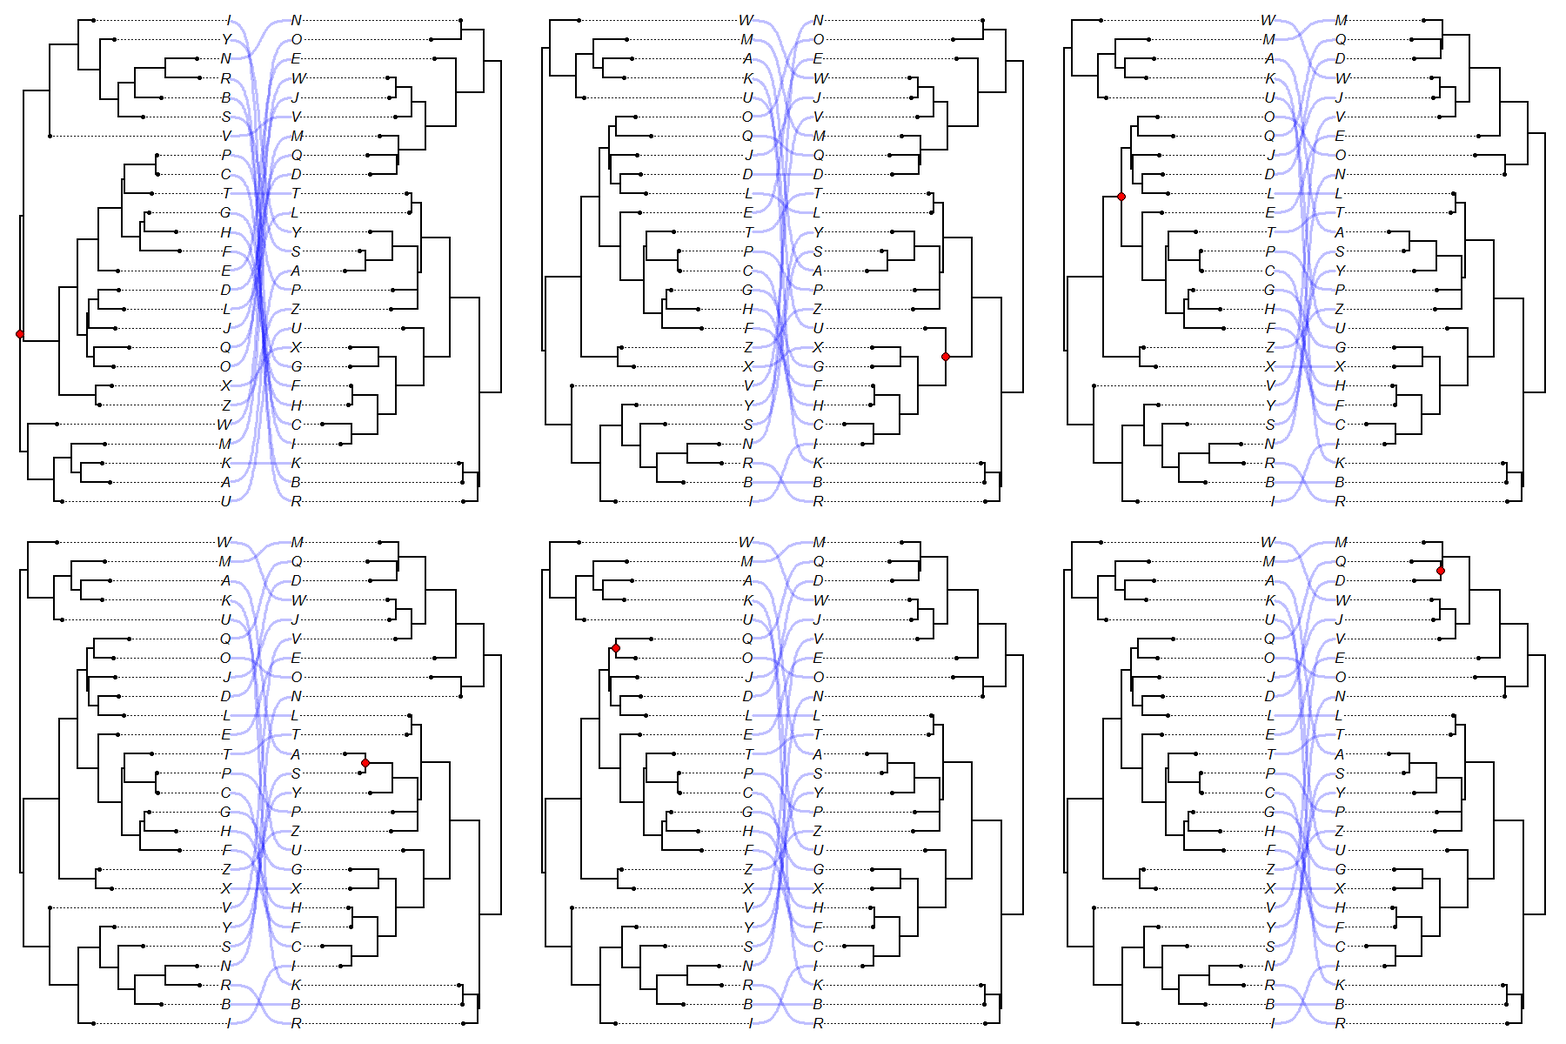
  8. Update to plot.cophylo to permit sigmoidal linking lines.
  9. New function to resolve a polytomous node in all possible ways. (Also here.)
  10. Function to reorder the daughter edges of a multifurcation in all possible ways.
  11. New option to rotate polytomies for co-phylogenetic plotting using the algorithm developed for [10.] (here).
  12. Speed up & fixes for collapseTree.
  13. New option to get the variance and confidence intervals for reconstructed tip states obtained using anc.ML.
  14. New function to plot the likelihood surface for the phytools function rateshift.
  15. Update to the function add.color.bar to permit the gradient color legend to be plotted vertically as well as horizontally.
  16. Additional user control of the S3 plot method for objects of class "cophylo".
  17. Updates to tip label plotting and a new S3 summary method for "cophylo" class objects.
  18. A new phytools function to find all possible node rotations of all nodes in a tree.
  19. A new exhaustive search for the cophylo function for co-phylogenetic plotting.
  20. Some updates to fitMk to permit more user control of optimization.
  21. A small fix to pass optional arguments to fitMk within make.simmap.
  22. A fun animated optimization method for cophylo. The animation, shown below, shows the tree traversal and the node rotations of the tree gradually being improved by the algorithm:
  23. A bug fix for add.color.bar.
  24. A very simple new cospeciation test in phytools.
  25. A function to compute a modified version of Grafen’s edge lengths.
  26. A cool S3 density method for objects of class "multiSimmap".
  27. Some new methods and user-control of phylogenetic scattergram plotting using fancyTree.
  28. Some updates to permit more user control of line end types in plotSimmap.
  29. An extremely simple function (bd) to pull birth & death (species & extinction) rates from an object of class "birthdeath" computed by ape.
  30. A simple new function and print method to compute AIC weights.
  31. And, finally, a bunch of other miscellaneous updates to address issues raised when updating ape & phangorn.

I know this isn't comprehensive, but it is a survey reflecting the wide range of updates & changes to the package. Of course, now that phytools is on GitHub, it's super easy to track all the committed changes the package has seen.

I'll post again when the updated phytools makes it on CRAN!

Tuesday, November 29, 2016

Some updates to phytools

I just pushed a series of updates (1, 2, 3, 4) to fix some issues raised by the authors of ape and phangorn in advance of the submission of new CRAN versions of those two packages.

The first was that I had inadvertently corrupted an S3 method multi2di of ape when I created the function multi2di.simmap without exporting a method to the namespace. The other issues came up in R CMD check and included such things as failing to import various functions from dependencies, other problems with the namespace, errors in documenting various variables, the absence of a manual page for one function (likSurface.rateshift) that is exported by phytools, and a few problems with the R code of some new functions.

I too hope to update the version of phytools on CRAN as the current version dates to June.

The latest phytools version can be installed from GitHub using devtools as follows:

library(devtools)
install_github("liamrevell/phytools")
Since both phangorn & ape are in the process of being updated, but phytools depends on the latest version of neither, you may need to do:

install_github("liamrevell/phytools",upgrade_dependencies=FALSE)

That's it.