Thursday, March 6, 2014

New function cladelabels

I just added a new function cladelabels to the phytools package. This function is in some ways analogous to nodelabels, tiplabels, etc. in ape. It basically implements the method I gave here, while taking advantage of the trick described here.

The code for this function is here, and it is also in a new phytools version, which can be downloaded here.

Here's a demo:

## this is just code to get a "realistic" looking tree
tree<-pbtree(n=26,tip.label=
  paste(LETTERS,"._",sapply(round(runif(n=26,min=3,max=6)),
  function(x) paste(sample(letters,x),collapse="")),sep=""),
  scale=1)
tree$edge.length<-tree$edge.length+0.1*rchisq(n=
  length(tree$edge.length),df=10)/10
plotTree(tree) ## also can use plot.phylo
nodelabels()
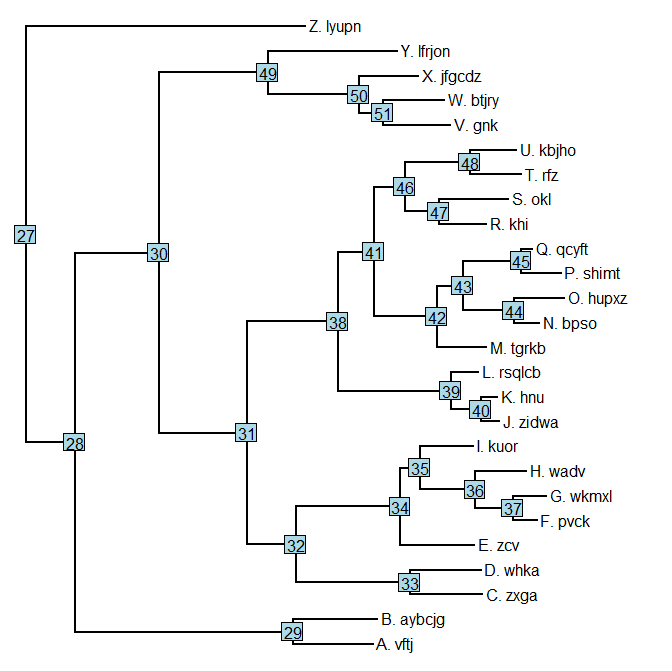
Now let's label the three clades descended from nodes 46 & 33; and then also node 28 (which is inclusive of node 33:

## adjust xlim to make sure there is space
plotTree(tree,xlim=c(0,1.25*max(nodeHeights(tree))),
  ftype="i")
cladelabels(tree,node=49,"Clade A")
cladelabels(tree,node=34,"Clade B")
cladelabels(tree,node=31,"Clade C",offset=3))

Cool - this was more or less what we were going for. We can also do this without sending cladelabels the tree, although in this case we need to provide some guidance on the space that cladelabels should leave for tip labels - otherwise it will assume a fixed width of 8 characters.

plotTree(tree,xlim=c(0,1.25*max(nodeHeights(tree))),
  ftype="i")
## delete the tree! (we really don't need it)
rm(tree)
cladelabels(node=49,text="Clade A",offset=4.5)
cladelabels(node=34,text="Clade B",offset=6)
cladelabels(node=31,text="Clade C",offset=9)

It's also fairly obvious how this could be combined with findMRCA to label clades on the basis of the taxa in the clade, rather than their specific MRCA node number. For instance:

plotTree(tree,xlim=c(0,1.25*max(nodeHeights(tree))),
  ftype="i")
tips<-c("L._rsqlcb","J._zidwa","K._hnu","M._tgrkb",
  "N._bpso","O._hupxz","P._shimt","Q._qcyft",
  "R._khi","S._okl","T._rfz","U._kbjho")
cladelabels(tree,node=findMRCA(tree,tips),text="clade D",
  offset=2)

Finally, it's possible to send the function multiple node numbers & clade labels in one function call - although at present this does not permit us to use different offset values. So:

cladelabels(tree,node=49,"Clade A")
cladelabels(tree,node=34,"Clade B")
## is the same as:
cladelabels(tree,node=c(49,34),text=c("Clade A","Clade B"))

One caveat important to mention is that at present this works only for rightward facing phylograms (or cladograms, for tree=NULL). This is not theoretically difficult to extend to other plot types, it just requires more work.

Wednesday, March 5, 2014

Extracting a "phylo" object from the last plotted tree

I stumbled on this trick while working on something else. When plot.phylo in ape or plotTree or plotSimmap in phytools are used to plot a tree the environmental variable last_plot.phylo is created. This variable is used to by nodelabels, tiplabels, and other functions that are used to add elements to the plotted tree. This object contains mostly information about the plotted tree - coordinates of vertices, etc. Today I realized that (almost) the entire "phylo" object can be reconstructed from this variable.

Here's how that works:

> tree<-pbtree(n=26,tip.label=LETTERS)
> plotTree(tree)
> ## delete the tree from memory
> rm(tree)
> ## last plotted tree
> lastPP<-get("last_plot.phylo",envir=.PlotPhyloEnv)
> ## reconstruct the tree in memory
> tree<-list(edge=lastPP$edge,
  tip.label=1:lastPP$Ntip,
  Nnode=lastPP$Nnode)
> ## now get the edge lengths
> H<-matrix(lastPP$xx[tree$edge],nrow(tree$edge),2)
> tree$edge.length<-H[,2]-H[,1]
> class(tree)<-"phylo"
> plotTree(tree)

The only thing we've lost is the tip labels.

That's it on this.

Drawing a line on a plotted tree to identify members of a clade

This is in response to a user request to the effect of I would like to place a vertical bar next to all the tips descended for a node that I specify. How do I do this?. Here's my answer:

First, here's our original tree. (Simulated, but generated to look like a realistic empirical tree).

plotTree(tree)
nodelabels()
## ok, let's say our node of interest is node 43
tree<-reorder(tree)
## get the tips numbers & thus their vertical
## positions
tips<-getDescendants(tree,43)
tips<-tips[tips<=length(tree$tip.label)]
## we're going to use these later!
## they assume cex=1, but could be adjusted otherwise
sw<-max(strwidth(tree$tip.label[tips]))
sh<-max(strheight(tree$tip.label))
## max height of the tips in our clade
## + their labels
h<-max(sapply(tips,function(x,tree)
    nodeHeights(tree)[which(tree$edge[,2]==x),2],
    tree=tree))+1.1*sw
## vertical line
lines(c(h,h),range(tips)+c(-sh,sh))
## upper & lower horizontal lines to demarcate the
## clade; their specific length is arbitrary
lines(c(h-0.5*sw,h),
    c(range(tips)[1]-sh,range(tips)[1]-sh))
lines(c(h-0.5*sw,h),
    c(range(tips)[2]+sh,range(tips)[2]+sh))
## label for the clade
text(h+0.5*strwidth("W"),mean(range(tips)),
    "clade of interest name",srt=90,pos=1)

That's pretty much it. Of course, the user should adapt this code to their specific tree and visualization goals.

Tuesday, March 4, 2014

Phylogenetic comparative methods mini-course at Universidad de los Andes, Bogotá

Luke Harmon, Andrew Crawford, and I will be co-teaching a phylogeny methods in R workshop at the Universidad de los Andes, Bogotá, Colombia this summer from the 8th to the 11th of July. This course is funded by the NSF and co-sponsored by U. los Andes and the University of Massachusetts Boston (my home institution).

More information in English & Spanish below:


Intensive short course on phylogenetic comparative methods in R (descripción en español abajo)

We are pleased to announce a new graduate-level intensive short course on the use of R for phylogenetic comparative analysis. The course will be four days in length and will take place at the Universidad de los Andes, Bogotá, Colombia from the 8th to the 11th of July, 2014. This course is partially funded by the National Science Foundation, with additional support from the University of Massachusetts Boston and the Universidad de los Andes. There are a number of full stipends available to cover the cost of travel, room and board for qualified students and post-docs. Applicants are welcome from any country; however we expect that most admitted students will come from Colombia and the Andean region. Accepted students from further afield may be offered only partial funding for their travel expenses. Topics covered will include: an introduction to the R programming language, tree manipulation, independent contrasts and phylogenetic generalized least squares, ancestral state reconstruction, models of character evolution, diversification analysis, and community phylogenetic analysis. Course instructors will include Dr. Liam Revell (University of Massachusetts Boston), Dr. Luke Harmon (University of Idaho), and Dr. Andrew J. Crawford (Universidad de los Andes).

Instruction in the course will be primarily in English; however some of the instructors and TAs of the course are competent or fluent in Spanish and English. Discussion, exercises, and activities will be conducted in both languages.

To apply for the course, please submit your CV along with a short (maximum 1 page) description of your research interests, background, and reasons for taking the course. Admission is competitive, and preference will go towards students with background in phylogenetics and a compelling motivation for taking the course. Applications should be submitted by email to bogota.phylogenetics.course@gmail.com by May 1st, 2014. Applications may be written in English or Spanish; however all students must have a basic working knowledge of scientific English. Questions can be directed to liam.revell@umb.edu.


Curso posgrado de métodos comparativos filogenéticos en R

Nos complace anunciar un nuevo curso corto e intensivo a nivel de posgrado sobre el uso de R en investigaciones científicas que usan métodos comparativos filogenéticos. El curso tendrá una duración de cuatro días y se llevará a cabo en la Universidad de los Andes (Bogotá, Colombia) entre el 8 y el 11 de julio de 2014. Este curso está parcialmente financiado por la National Science Foundation de los Estados Unidos, con el apoyo adicional de la Universidad de Massachusetts Boston y la Universidad de los Andes. Hay varios estipendios completos disponibles para cubrir los costos de tiquetes y alojamiento para estudiantes e investigadores postdoctorales calificados. Estudiantes de cualquier país serán aceptados; sin embargo anticipamos que la mayoría de los estudiantes aceptados serán de Colombia y otros países andinos. Estudiantes provenientes de países más alejados tendrán la posibilidad de recibir solo apoyo parcial para costear los gastos del viaje. Los temas que serán discutidos en el curso incluyen: una introducción al idioma de programación de R, manipulación de los árboles filogenéticos, mínimos cuadrados generalizados en un contexto filogenético, reconstrucciones de los estados ancestrales, modelos de evolución, análisis de la diversificación en el contexto de una filogenia, y análisis filogenéticos de comunidades ecológicas. Los instructores del curso serán: Dr. Liam Revell (University of Massachusetts Boston), Dr. Luke Harmon (University of Idaho), y Dr. Andrew J. Crawford (Universidad de los Andes).

El curso será dictado principalmente en inglés; sin embargo algunos de los instructores y TA del curso hablan fluido el español. Las discusiones, los ejercicios, y las actividades del curso se harán en español e inglés.

Para aplicar al curso, deben enviar una copia de su CV con una corta (1 página) descripción de sus intereses científicos, experiencia, y razones por las cuales quieren tomar el curso. El proceso de admisión será competido, y se preferirán estudiantes con conocimientos en filogenética y una motivación persuasiva para hacer el curso. Las aplicaciones deben ser enviadas por email a bogota.phylogenetics.course@gmail.com antes del 1 mayo, 2014. Las aplicaciones pueden ser escritas en inglés o español; sin embargo todos los estudiantes deben tener un nivel básico de inglés científico. Preguntas pueden ser dirigidas a liam.revell@umb.edu.

Monday, March 3, 2014

New version of rateshift; new version of phytools submitted to CRAN

Some comments on earlier version of the function rateshift for identifying one or multiple shifts in the Brownian rate of evolution on the tree suggested that there were some difficulties in converging to the ML solution. Indeed, this is not too surprising. I have now posted a new version of rateshift that has more robust optimization. Here's a quick demo:

> require(phytools)
Loading required package: phytools
Loading required package: ape
Loading required package: maps
Loading required package: rgl
> packageVersion("phytools")
[1] ‘0.3.93’
> ## simulate tree & data
> tree<-pbtree(n=100,scale=1)
> tree<-make.era.map(tree,c(0,.5))
> x<-sim.rates(tree,c(10,1),internal=TRUE)
names absent from sig2: assuming same order as $mapped.edge
> ## here's a visual of our simulation
> phenogram(tree,x,ftype="off")
> ## peel off ancestral states
> x<-x[tree$tip.label]
> ## fit one-rate model:
> fit1<-rateshift(tree,x,nrates=1)
Optimization progress:
|..........|
Done.

> ## fit two-rate model:
> fit2<-rateshift(tree,x,nrates=2)
Optimization progress:
|..........|
Done.

> fit1
ML 1-rate model:
        s^2(1)  se(1)   k       logL  
value   1.5419  0.2179  2       -89.379
This is a one-rate model.

R thinks it has found the ML solution.

> fit2
ML 2-rate model:
        s^2(1)  se(1)   s^2(2)  se(2)   k       logL  
value   7.3925  4.0858  1.2412  0.1903  4       -85.911

Shift point(s) between regimes (height above root):
        1|2     se(1|2)
value   0.5274  0.01

R thinks it has found the ML solution.

In addition, I was recently informed that the package extrafonts has been removed from CRAN. phytools depends on extrafonts for the plotting functions xkcdTree and fancyTree. To address this dependency issue I have now removed xkcdTree from phytools (source code is still available from the phytools page) and modified fancyTree so that it no longer uses extrafonts. This new version has now been submitted to CRAN. It is already available on phytools.org.

Wednesday, February 26, 2014

Rphylip mostly done....

I've been continuing to plug away at Rphylip, our new R interface for Joe Felsenstein's phylogeny methods package PHYLIP. More information about this effort can be found here: 1, 2, 3, 4, 5, 6, 7, 8, 9, 10. The latest additions are Rkitsch, an interface for KITSCH (a least-squares & ME inference program with a clock constraint); Rrestdist, an interface for RESTDIST (a program for distance calculation from restriction site or fragment data); Rrestml, an interface for RESTML (a restriction site ML tree inference program); and Rclique, an interface for CLIQUE (phylogeny inference from binary characters by the compatibility method). I also added a new object class, "rest.data", for restriction data, as well as some methods to convert to the class & print.

Rphylip is on GitHub, and the latest build can be downloaded & installed from source.

Here's a quick demo of Rrestml using the demo dataset from the RESTML documentation in PHYLIP:

> require(Rphylip)
Loading required package: Rphylip
Loading required package: ape
> packageVersion("Rphylip")
[1] ‘0.1.20’
> data(restriction.data)
> restriction.data
13 restriction site scores for 5 species stored in a object of class "rest.data".

All sequences of same length: 13

Number of restriction enzymes used to generate the data: 2

Labels: Alpha Beta Gamma Delta Epsilon

> mltree<-Rrestml(restriction.data,quiet=TRUE)

Restriction site Maximum Likelihood method, version 3.695


  Recognition sequences all 6 bases long

Sites absent from all species are assumed to have been omitted


     +2        
  +--1 
  |  |  +4        
  |  +--2 
  |     +5        
  | 
  3----3        
  | 
  +1        


remember: this is an unrooted tree!

Ln Likelihood =   -40.31850


Between  And  Length   Approx. Confidence Limits
-------  ---  ------   ------- ---------- ------
   3        1  0.01396  (     zero,     0.04907)
   1     2     0.00064  (     zero,    infinity)
   1        2  0.05872  (     zero,     0.12666) **
   2     4     0.01447  (     zero,     0.04458) **
   2     5     0.00100  (     zero,    infinity)
   3     3     0.10801  (  0.01151,     0.21877) **
   3     1     0.01046  (     zero,     0.04404)

     *  = significantly positive, P < 0.05
     ** = significantly positive, P < 0.01

> plot(mltree,no.margin=TRUE,type="unrooted",edge.width=2)

OK. That's all for now. We're still working on documentation & examples, but hopefully we will have a version on CRAN before too long.

New faster version of ltt (& ltt95) for ultrametric trees

Some phytools users reported problems with the phytools function ltt95 (for plotting a 95% high probability LTT from a posterior sample of trees). This is likely due to the use of ltt internally, which is very slow. The reason it is slow is because it does not assume that the tree is ultrametric (& is probably unnecessarily slow even so, but that's a problem for another day). If we first check if the tree is ultrametric we can call branching.times internally which is fast, and everything else is sped along considerably.

I have now done that. The updated code is here & it is also part of a new phytools build (here) which can be downloaded & installed from source. When the trees in the posterior sample are ultrametric, the speed-up that results is really extraordinary (about 10× for a tree with 100 taxa).