Friday, November 16, 2012

Addendum to adding a single tip to the tree

Yesterday I posted an extremely simple function for adding an extra tip to the tree. In response to a user request, here is an addendum in which the function also checks if the tree is ultrametric and (so long as a custom branch length is not supplied) computes a branch length for the added tip such that the tree remains ultrametric after the new tip is added. Since this wraps around the 'ape' function bind.tree, I have also added the argument position, which is the distance below the specified node where the new tip should be added. First, here's the function:

bind.tip<-function(tree,tip.label,edge.length=NULL, where=NULL,position=0){
  if(is.null(where)) where<-length(tree$tip)+1
  if(is.null(edge.length)&&is.ultrametric(tree)){
    H<-nodeHeights(tree)
    if(where==(length(tree$tip)+1))
     edge.length<-max(H)
    else
     edge.length<-max(H)-H[tree$edge[,2]==where,2]+position
  }
  tip<-list(edge=matrix(c(2,1),1,2),
    tip.label=tip.label,
    edge.length=edge.length,
    Nnode=1)
    class(tip)<-"phylo"
  obj<-bind.tree(tree,tip,where=where,position=position)
  return(obj)
}

And here's a demo:
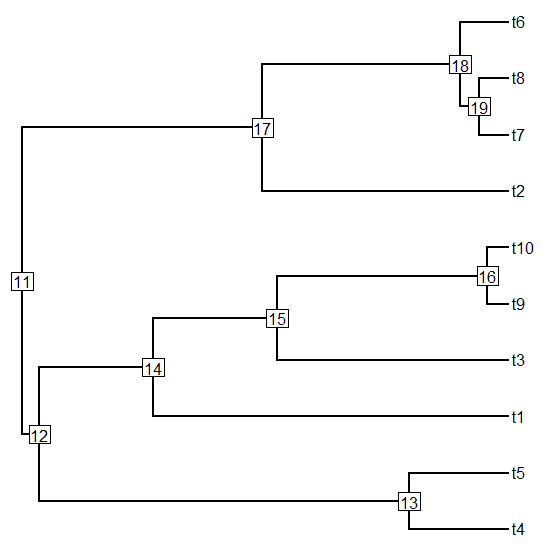
> tree<-pbtree(n=10)
> plotTree(tree,node.numbers=T)
> # now add 1/2 branch length below node 16
> tree2<-bind.tip(tree,"t11",where=16, position=0.5*tree$edge.length[which(tree$edge[,2]==16)])
> plotTree(tree2,node.numbers=T)
Cool - it works.

Note that if we want to add a new terminal edge along a branch leading to a tip - we have to specify the tip by node number not tip label. So, for instance, to add another tip to our new tree halfway along the branch leading to tip t11, we would do:
> tree3<-bind.tip(tree2,"t12",
 where=which(tree2$tip.label=="t11"),
 position=0.5*tree2$edge.length[which(tree2$edge[,2]==
 which(tree2$tip.label=="t11"))])
> plotTree(tree3,node.numbers=T)

Thursday, November 15, 2012

Adding a single tip to a tree

A R-sig-phylo member writes:

Dear list members,
I have a large phylogeny to which I need to add branches of a certain length (new taxa) at specific nodes.
I have experimented with bind.tree (ape) and paste.tree (phytools) but they only let you bind trees to together. I can cobble together code that adds a 2 species tree and then erase one of the tips using drop.tip but this is difficult given how the node labels change.
I want to automate this process because I have ~180 additions to make and I want to repeat the additions using branches of different length.
Ideally I would like to have a function where I input the node number to which a branch should be added, the length of that branch, and the name of the tip.
Any suggestions?


It seems like the basic problem is not that bind.tree and paste.tree don't work; but rather that they only attach two bifurcating trees together, and the user wants to attach one tip to a tree.

Well, it turns out that this is not too hard. Here's how, by way of demonstration:

> library(phytools)
> # simulate receptor tree
> tree<-pbtree(n=10)
> plotTree(tree,node.numbers=T)
> # create tip (modify as desired)
> tip<-list(edge=matrix(c(2,1),1,2),
    tip.label="species.name",
    edge.length=1.0,
    Nnode=1)
> class(tip)<-"phylo"
> # attach to any node (say, node 16)
> btree<-bind.tree(tree,tip,where=16)
> plotTree(btree)

Ok, how about writing a function for it? Let's call it bind.tip:

bind.tip<-function(tree,tip.label,edge.length=NULL,where=NULL){
  if(is.null(where)) where<-length(tree$tip)+1
  tip<-list(edge=matrix(c(2,1),1,2),
    tip.label=tip.label,
    edge.length=edge.length,
    Nnode=1)
  class(tip)<-"phylo"
  obj<-bind.tree(tree,tip,where=where)
  return(obj)
}

That's it.

Wednesday, November 14, 2012

Function to break up plotted tree into multiple columns of figures

In early October, a R-sig-phylo query was submitted that read as follows:

I'm wondering if there is a way to plot a phylogeny in R that is broken up and displayed side by side to condense space. I've made a backbone in R that i'd like to make into a figure, but it is too tall. If this isn't the write setup, could someone suggest what program (and format for me to write.tree) from R. I am using windows, in terms of potential third part programs.

Well, I thought this sounded like a neat idea. We often see trees plotted this way in published articles, but there is no native function in R to produce this kind of plot. Unfortunately, I didn't have time to work on this until recently - so most likely, the author of the R-sig-phylo question has already solved this problem in some other way. Nonetheless. . . . .

(I should note that, in discussing this function with my friend Luke Harmon, he warned me that I was stuck in the "paper paradigm" - for more on what that means, see Luke's article with James Rosindell.)

Ignoring Luke (as is my wont), I just posted a function for this anyway. The function, splitplotTree, can be downloaded from my phytools page (direct link to code here).

A little bit about how I did this. . . . To plot a phylogram we need two coordinate matrices: a matrix for the heights of the nodes above the root; and a matrix for the vertical position of the edges. We get the former for a "phylo" object by using (say) nodeHeights in phytools. To get the latter, we can just evenly space the tip nodes on our vertical axis (for a rightward facing tree); and then work down through their common ancestors to the root, averaging the vertical position of the descendant nodes to obtain the height of each parent.

Having done this, to split the tree horizontally we just have to select a cutting point. Then we split our matrices based on this point. After some adjustments, we plot our trees in each plot window. Finally, we have to plot the vertical lines (the lines connecting daughter edges) that would normally connect the two plots. This is easy. For the upper panel tree slice, we just plot a line from each unmatched node to the lower edge of the plot; and for the lower panel tree, we do the opposite. The result will look something like this:

> library(phytools)
> source("splitplotTree.R")
> tree<-pbtree(n=100)
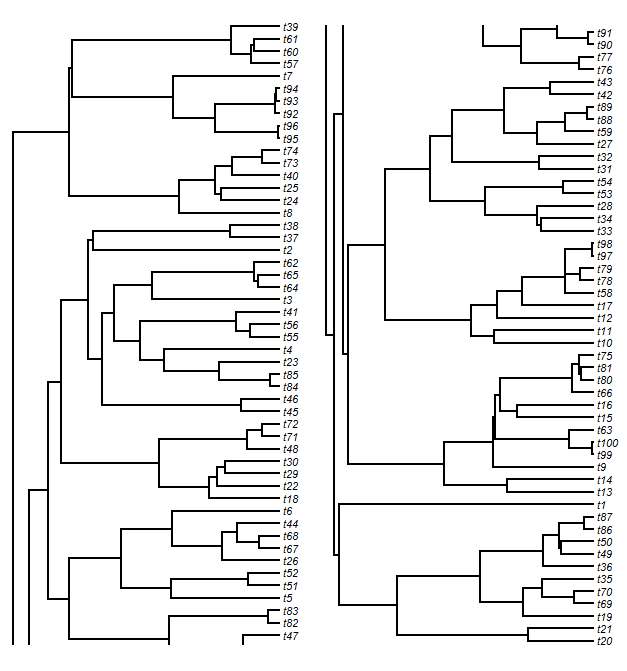
> splitplotTree(tree,fsize=0.7,ftype="i",split=0.5)


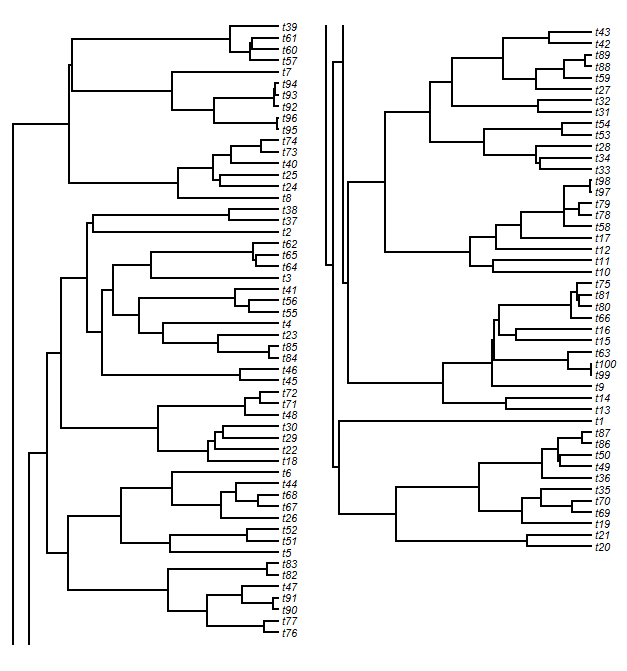
We might look at this and decide that we don't like the look of the slice point split and would prefer to break the tree, say, between tips t76 and t43. After some fiddling, we can figure out where that split point needs to be:

> splitplotTree(tree,fsize=0.7,ftype="i",split=0.54)
Note that the vertical position of the tree is automatically adjusted so that the spacing of the tips is equal in both panels.

If we would rather plot our tree in two windows, rather than in side-by-side panels (say, for publication across two journal pages), we can do that too.

> splitplotTree(tree,fsize=0.7,ftype="i",split=0.54, new.window=TRUE)

Panel 1:
and panel 2:
Finally, the function can also be used to create a silly (and, so far as I know, entirely useless) animation of a tree gradually sliding from one side of a plotting window to another. Here, for the Greater Antillean anole tree:


And the code used to do this (minus functions for saving frames to movie file for external viewing):
# code for animation
layout(matrix(c(1,2),1,2))
plotTree(anoletree,fsize=0.7,ftype="i"); layout(1)
for(i in 198:2) splitplotTree(anoletree,split=i/200,fsize=0.7,ftype="i")
layout(matrix(c(2,1),1,2))
plotTree(anoletree,fsize=0.7,ftype="i"); layout(1)

That's it!

Tuesday, November 13, 2012

Bug fix for phyl.RMA

I recently received the following bug report for the phytools function for reduced major axis regression (phyl.RMA):

I've been encountering an error when trying to run phyl.RMA:
Error in D %*% t(a) : non-conformable arguments
In addition: Warning message:
In if (lambda == 1) return(C) else { :
the condition has length > 1 and only the first element will be used
What's odd is that with R 2.15.1 and the previous version of phytools, it ran perfectly. But today I updated to R 2.15.2 and the latest version of phytools, and it's a no-go. Any idea what's going on here?


Indeed - I can reproduce this error easily:

> require(phytools)
Loading required package: phytools
...
> tree<-pbtree(n=100)
> x<-fastBM(tree)
> y<-fastBM(tree)
> args(phyl.RMA)
function (x, y, tree, method = "BM", lambda = NULL, fixed = FALSE,
    h0 = 1)
NULL
> phyl.RMA(x,y,tree)
Error in D %*% t(a) : non-conformable arguments
In addition: Warning message:
In if (lambda == 1) return(C) else { :
  the condition has length > 1 and only the first element will be used

Turns out, though, that the association with R 2.15.2 is completely spurious. The real problem came when I moved the code for various utility functions out of the functions that used them, such as phyl.pca, phyl.cca, and, lo & behold, phyl.RMA. As it turned out, some of the argument list order differed between different iterations of internally called functions (the culprit in this case was lambda.transform).

I have fixed the problem, and the revised function (here) seems to work:

> source("phyl.RMA.R")
> phyl.RMA(x,y,tree)
$RMA.beta
[1] 0.06725208 0.86425086
$V
           x          y
x 0.93872556 0.06935903
y 0.06935903 0.70116186
$lambda
[1] 1
$logL
[1] -264.4581
$test
        r2           T          df           P
0.00730885  1.44956623 99.64317035  0.15031966
$resid
              [,1]
t39  -0.2958474582
t40   0.5487124406
t9    ...

Good.

New version of phytools (0.2-1) on CRAN

There is a new version of phytools on CRAN (phytools 0.2-1). This can be downloaded and installed from source from the CRAN or from the phytools webpage. It should also be available for installation using install.packages("phytools") some time in the next few days as the Mac OS and Windows binaries are built and phytools 0.2-1 percolates through the CRAN mirrors.

I have made a few small updates, mostly to documentation, from the last minor (non-CRAN) package version, phytools 0.2-05, but otherwise it is the same. There are lots of updates of note, though, with respect to the previous CRAN release (phytools 0.2-0). Here's a list of the major items:

1. A new function (fastAnc) for fast ML ancestral state estimation (1, 2).

2. A new function (matchNodes) to match nodes between trees.

3. A new function (xkcdTree) to plot xkcd style phylogenetic trees (1, 2, 3, 4, 5, 6, 7). xkcdTree can also be called from within fancyTree.

4. A new Bayesian MCMC method (ancThresh) for ancestral character estimation under the treshold model (1, 2, 3, 4).

5. A new function (multi.mantel) for multiple matrix regression with Mantel test (i.e., "partial Mantel tests").

6. A new method and function (densityMap) for visualizing the posterior density from stochastic mapping on the tree (1, 2).

7. Finally, a new function (contMap) for plotting the reconstructed values of a continuously valued trait on the tree (1, 2).

The phytools R package now contains over 80 different function and an 87 page PDF manual. Yikes!

Monday, November 12, 2012

New URL

The phytools blog has a new URL: blog.phytools.org. This should not affect the way readers experience the phytools blog, and all old links with the phytools.blogspot.com URL should be unaffected.

In addition, the URL www.phytools.org should automatically redirect to the phytools development page.

Thanks for reading!

Sunday, November 11, 2012

Update to the visual theme of the blog

After nearly two years and over 300 posts, I decided to make some minor changes to the theme & background of the blog. The most obvious one is the the updated background image & color (reproduced here at right).

Since the original background image (a radial tree with a multicolored stochastic mapping) was created before phytools had any graphical functions (and, in fact, before the package formally existed), I thought the update was overdue. The new images were created using densityMap and contMap with some very minor post-hoc editing.