Thursday, March 15, 2018

More on morphing a cladogram into phylomorphospace

Yesterday I posted a function to animation the projection of a phylogeny into so-called 'phylomorphospace.' Basically the function morphs a cladogram into morphospace.

I have now updated this function & added it to the phytools package so it can be obtained merly by updating phytools from GitHub using devtools

The update consisted of doing a few things:

1) I eliminated a (hard to notice except when converted to .gif) first blank plotting device using par(new=TRUE).

2) I allow users to morph backwards from phylomorphospace to tree, forwards, or both.

Complete code of the function can be seen above; however for the plot below I also made a small 'fix' (using fix) the internally used phylomorphospace which I intend to add as an option later.

Here's a demo:

library(phytools)
packageVersion("phytools")
## [1] '0.6.58'
tree
## 
## Phylogenetic tree with 40 tips and 39 internal nodes.
## 
## Tip labels:
##  t19, t20, t5, t15, t16, t8, ...
## 
## Rooted; includes branch lengths.
X
##            [,1]       [,2]
## t19  3.50708037 -1.1096582
## t20  4.27937896 -1.2525421
## t5   0.08209894 -2.6875071
## t15  1.47192856 -3.3443560
## t16  1.74646002 -2.1723942
## t8   1.47101027 -3.9437620
## t39  3.03199098 -3.7106981
## t40  2.80301669 -4.0854970
## t13  1.95146677 -2.9904940
## t12  1.33706669 -4.8753683
## t17  0.67514002 -4.3273505
## t18  0.63260813 -2.9261122
## t2  -0.70893947 -5.9488395
## t3  -1.54193957 -4.8277646
## t6  -1.63946177 -7.8730380
## t7  -0.94456462 -8.8354219
## t9  -0.16164120 -0.6339037
## t10  2.18203703  1.4402154
## t26  0.98913114  2.3696318
## t31  1.98265867  1.3857154
## t32  1.45834021  1.7523258
## t1   0.90273795 -0.6776714
## t24  0.09296010 -0.9788181
## t25 -0.60155598 -1.0161882
## t28  0.36367701 -1.6175121
## t37 -0.21208935 -2.9695885
## t38 -0.24609233 -3.0210521
## t4   2.96819592 -1.9776346
## t23  1.77672273 -1.5263565
## t29  2.24431018 -0.4320801
## t30  2.41836111 -0.9098723
## t11  0.94537923 -1.8870267
## t27  0.20277275  0.5987702
## t33  0.66893070 -0.3095932
## t34  0.69709488  0.5173531
## t14  0.18474066 -1.4782937
## t35  2.09494024 -1.3206123
## t36  1.26653380 -1.2547774
## t21  1.36309613 -0.8358357
## t22  1.24269972 -0.7635959
ee<-setNames(rep("blue",nrow(tree$edge)),
    tree$edge[,2])
nn<-setNames(rep("grey",Ntip(tree)),1:Ntip(tree))
project.phylomorphospace(tree,X,xlab="x",ylab="y",
    node.size=c(0,1.4),direction="both",nsteps=400,ftype="off",
    control=list(col.edge=ee,col.node=nn),lwd=2)
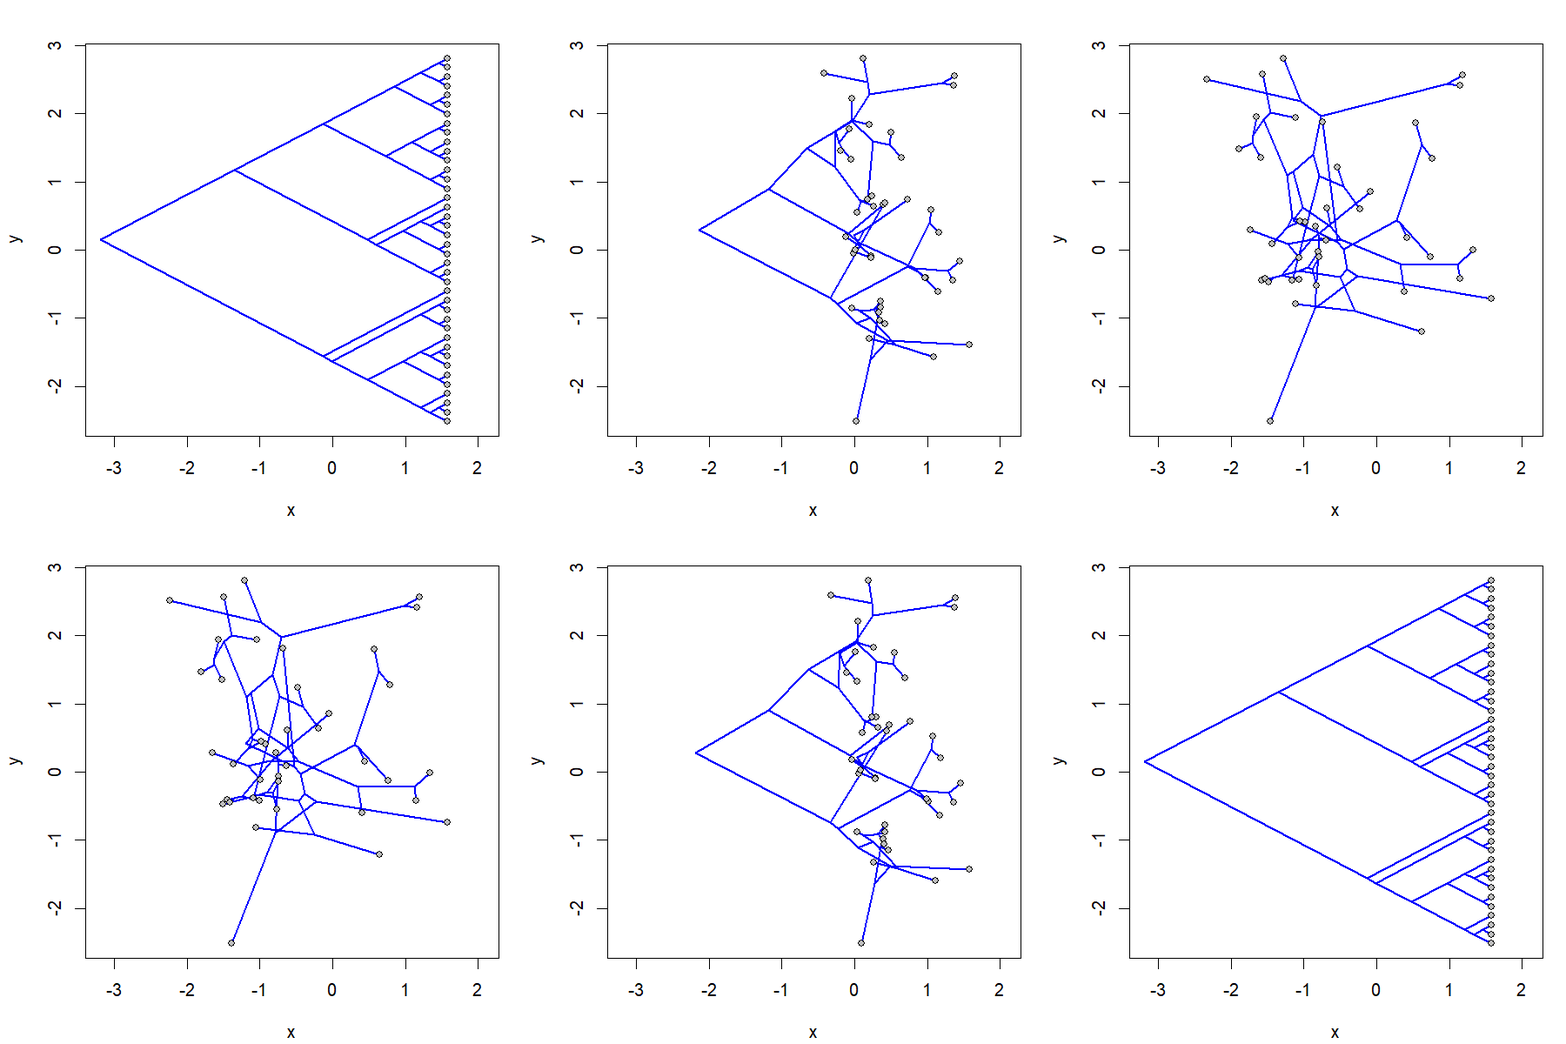
I simulated the data for x & y as follows:

tree<-pbtree(n=40)
vcv<-matrix(c(1,0,0,1),2,2)
X<-sim.corrs(tree,vcv)

and, as I've shown before, the .gif above was generated using ImageMagick which is super-handy for embedding such things into presentations & so on:

png(file="ppm-%04d.png",width=600,height=600,res=120)
par(mar=c(4.1,4.1,2.1,1.1))
project.phylomorphospace(tree,X,xlab="x",ylab="y",
    node.size=c(0,1),direction="both",nsteps=100,ftype="off",
    control=list(col.edge=ee,col.node=nn),lwd=2)
dev.off()
system("ImageMagick convert -delay 10 -loop 0 *.png 15Mar18-post.gif")
file.remove(list.files(pattern=".png"))
Wednesday, March 14, 2018

Animated phylomorphospace projection

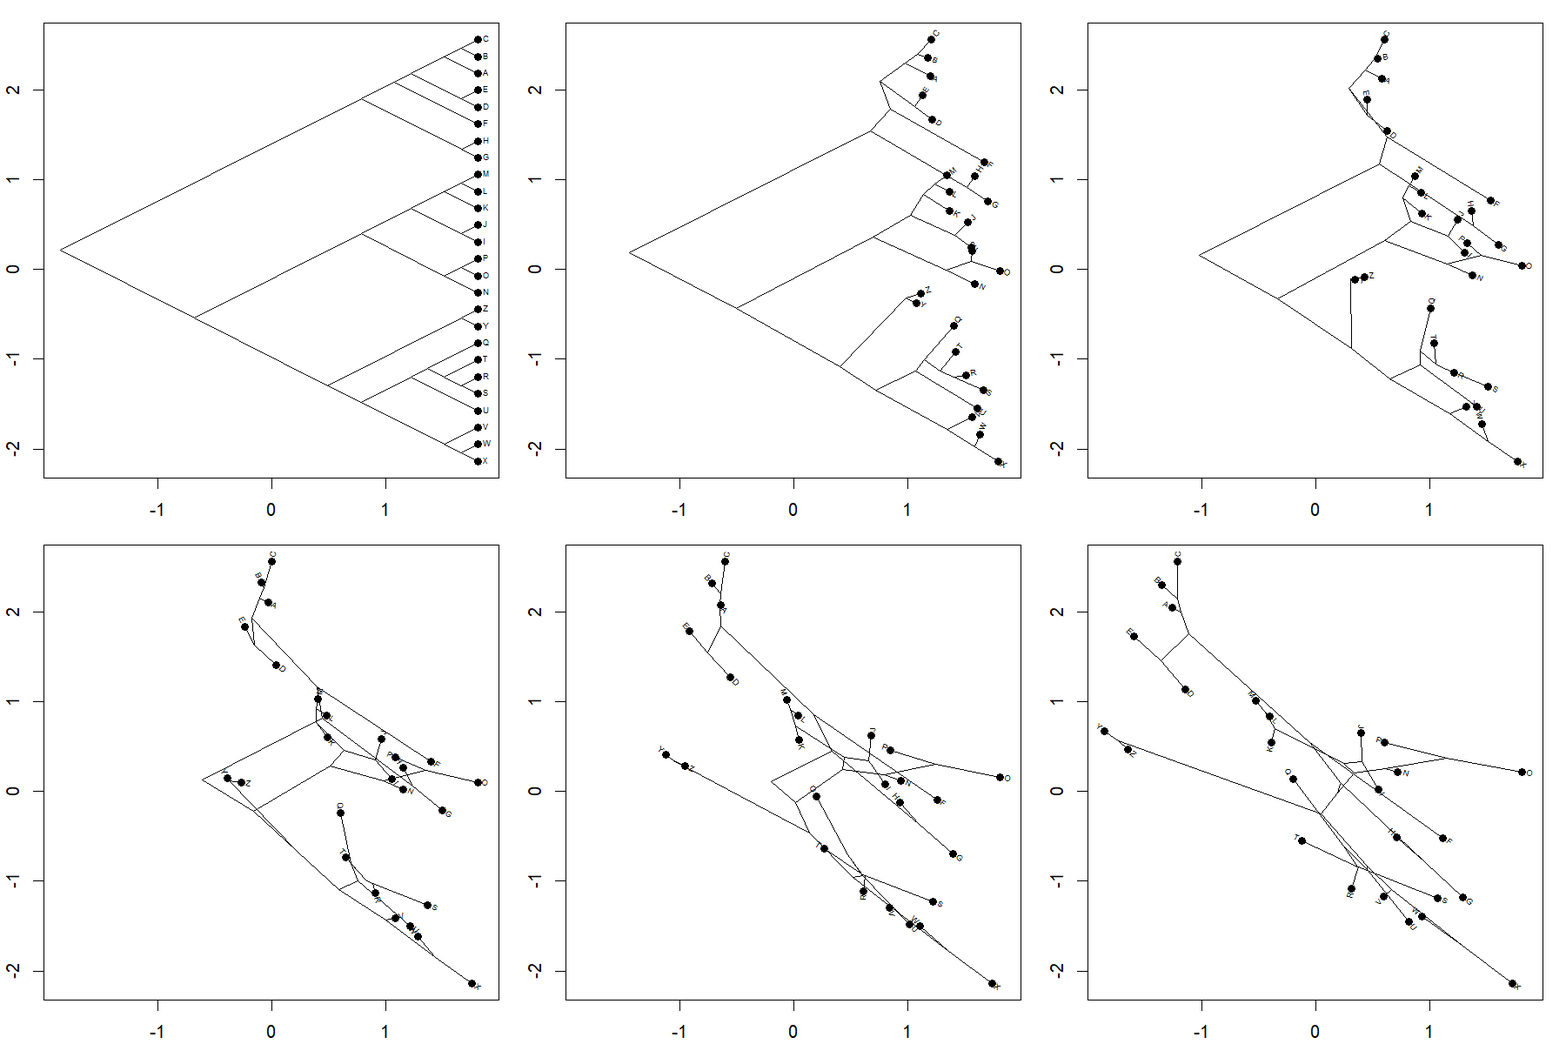
The so-called 'phylomorphospace' is a projection of the tree into phenotypic space for quantitative traits. Consequently, I thought it might be fun to try & animate this projection - that is, to visualize the transformation of the tree from the way it's typically projected into a phylomorphospace.

This could look something like the following:

project.phylomorphospace<-function(tree,X,nsteps=1000,sleep=0,...){
    tree<-minRotate(reorder(tree,"cladewise"),X[,2],print=FALSE)
    X<-X[tree$tip.label,]
    A<-cbind(fastAnc(tree,X[,1]),fastAnc(tree,X[,2]))
    cladogram<-tree
    cladogram$edge.length<-NULL
    mar<-par()$mar
    plotTree(cladogram,type="cladogram",nodes="centered",plot=FALSE)
    obj<-get("last_plot.phylo",envir=.PlotPhyloEnv)
    obj$xx<-obj$xx*(max(c(X[,1],A[,1]))-min(c(X[,1],A[,1])))+
        min(c(X[,1],A[,1]))
    xlim<-range(obj$xx)
    xlim[2]<-xlim[2]+max(strwidth(tree$tip.label))
    obj$yy<-(obj$yy-min(obj$yy))/(max(obj$yy)-min(obj$yy))*
        (max(c(X[,2],A[,2]))-min(c(X[,2],A[,2])))+min(c(X[,2],A[,2]))
    ylim<-range(obj$yy)
    X0<-cbind(obj$xx[1:Ntip(tree)],obj$yy[1:Ntip(tree)])
    rownames(X0)<-tree$tip.label
    A0<-cbind(obj$xx[1:tree$Nnode+Ntip(tree)],
        obj$yy[1:tree$Nnode+Ntip(tree)])
    rownames(A0)<-1:tree$Nnode+Ntip(tree)
    par(mar=mar)
    phylomorphospace(tree,X0,A0,label="horizontal",xlim=xlim,
        ylim=ylim,...)
    for(i in 1:nsteps){
        Sys.sleep(sleep)
        dev.hold()
        phylomorphospace(tree,((nsteps-i)*X0+i*X)/nsteps,
            ((nsteps-i)*A0+i*A)/nsteps,xlim=xlim,ylim=ylim,
                ...)
        dev.flush()
    }
}

And if we try it out:

library(phytools)
project.phylomorphospace(tree,X,xlab="",ylab="",
    node.size=c(0,1.2))

Kinda neat?

The .gif I generated as follows:

png(file="ppm-%04d.png",width=600,height=600,res=120)
par(mar=c(2.1,2.1,1.1,1.1))
project.phylomorphospace(tree,X,xlab="",ylab="",
    node.size=c(0,1),lwd=1,nsteps=100,fsize=0.6)
dev.off()
system("ImageMagick convert -delay 10 -loop 2 *.png 14Mar18c-post.gif")
file.remove(list.files(pattern=".png"))

Finally, here's how I simulated the tree & data:

tree<-pbtree(n=26,tip.label=LETTERS)
vcv<-matrix(c(1,-0.8,-0.8,1),2,2)
X<-sim.corrs(tree,vcv)

Some points moving around randomly in a box

For my PopGen I was thinking about writing some spatial population genetic simulations.

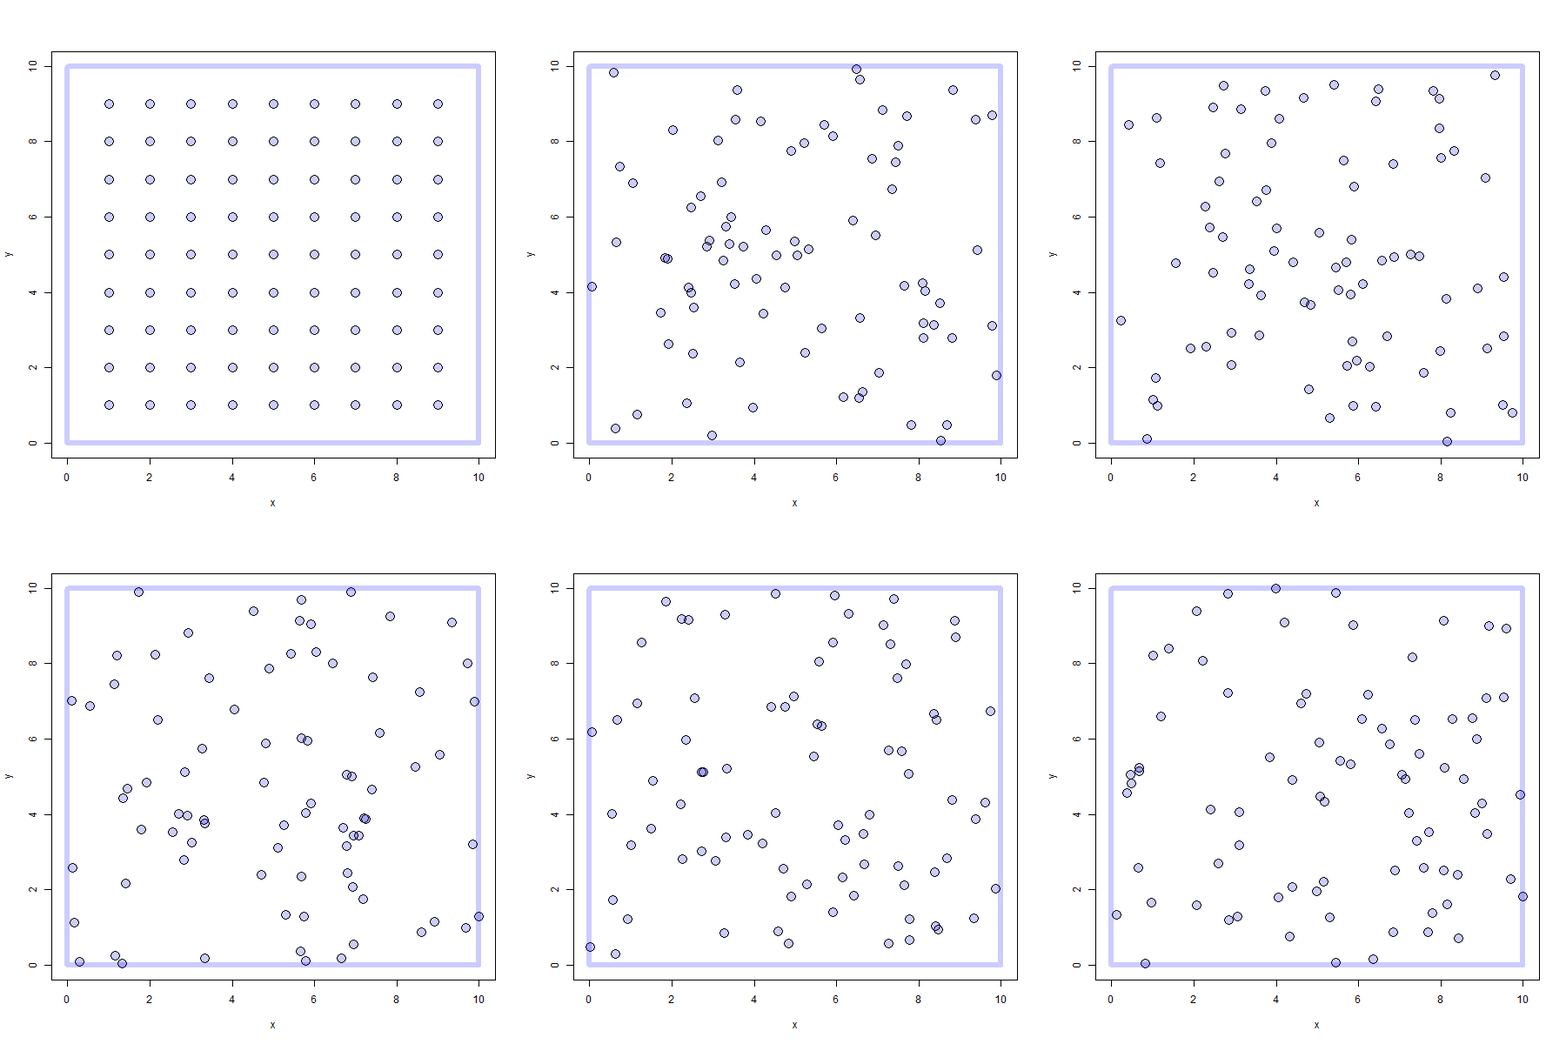
First I thought I'd write a little animation of things moving randomly in two dimensions. Here's what that looks like:

moving.randomly<-function(sig2=0.1,ngen=1000,sleep=0.1){
    x<-rep(1:9,9)
    y<-c()
    for(i in 1:9) y<-c(y,rep(i,9))
    n<-length(x)
    dev.hold()
    plot(x,y,xlim=c(0,10),ylim=c(0,10),pch=21,
        bg=phytools:::make.transparent("blue",0.2),cex=2)
    lines(c(0,0,10,10,0),c(0,10,10,0,0),lwd=6,
        col=phytools:::make.transparent("blue",0.2))    
    dev.flush()
    for(i in 1:ngen){
        x<-x+rnorm(n=n,sd=sqrt(sig2))
        while(!(all(x<10)&&all(x>0))){
            x[which(x<0)]<-abs(x[which(x<0)])
            x[which(x>10)]<-10-(x[which(x>10)]-10)
        }
        y<-y+rnorm(n=n,sd=sqrt(sig2))
        while(!(all(y<10)&&all(y>0))){
            y[which(y<0)]<-abs(y[which(y<0)])
            y[which(y>10)]<-10-(y[which(y>10)]-10)
        }
        dev.hold()
        plot(x,y,xlim=c(0,10),ylim=c(0,10),pch=21,
            bg=phytools:::make.transparent("blue",0.2),cex=2)
        lines(c(0,0,10,10,0),c(0,10,10,0,0),lwd=6,
            col=phytools:::make.transparent("blue",0.2))
        dev.flush()
        Sys.sleep(sleep)
    }
}
moving.randomly(sig2=0.01)

The above .gif I actually made & then subsequently embedded in the .html using ImageMagick as follows:

png(file="mr-%04d.png",width=600,height=600)
moving.randomly(sig2=0.01,sleep=0)
dev.off()
system("ImageMagick convert -delay 10 -loop 0 *.png 14Mar18b-post.gif")
file.remove(list.files(pattern=".png"))

Thursday, March 8, 2018

Simulating migration, natural selection, & genetic drift in R

I just added another function to my evolutionary genetics teaching R package, PopGen to simulate the simultaneous actions of migration, natural selection, & genetic drift.

Here is what the function code looks like:

msd<-function(p0=c(0.5,0.5),Ne=c(100,100),
    w=list(c(1,1,1),c(1,1,1)),m=c(0.01,0.01),ngen=400,
    colors=c("red","blue"),...){
    if(hasArg(show.legend)) show.legend=list(...)$show.legend
    else show.legend<-TRUE
    w<-lapply(w,function(w) (w/max(w))[3:1])
    gametes<-lapply(Ne,function(Ne) rep(0,2*Ne))
    gametes<-mapply(function(p0,g,N){
        g[1:round(p0*2*N)]<-1
        g},p0=p0,g=gametes,N=Ne,SIMPLIFY=FALSE)
    p<-lapply(gametes,mean)
    for(i in 1:ngen){
        genotypes<-lapply(gametes,function(x) matrix(sample(x),
            length(x)/2,2))
        migrants<-mapply(function(N,m) which(runif(N)<=m),N=Ne,
            m=m,SIMPLIFY=FALSE)
        for(j in 1:length(genotypes)){
            to<-if(j==1) 2 else 1
            genotypes[[to]]<-rbind(genotypes[[to]],
                genotypes[[j]][migrants[[j]],])
        }
        for(j in 1:length(genotypes)){
            if(length(migrants[[j]])>0)
                genotypes[[j]]<-genotypes[[j]][-migrants[[j]],]
        }
        fitness<-mapply(function(x,w) w[rowSums(x)+1],x=genotypes,
            w=w,SIMPLIFY=FALSE)
        selected<-mapply(function(prob,N,Ne) 
            cbind(sample(N,Ne,prob=prob,replace=TRUE),
            sample(N,Ne,prob=prob,replace=TRUE)),prob=fitness,
            N=sapply(genotypes,nrow),Ne=Ne,SIMPLIFY=FALSE)
        copy<-lapply(Ne,function(Ne)
            matrix(sample(1:2,2*Ne,replace=TRUE),Ne,2))
        gametes<-mapply(function(g,s,c) c(diag(g[s[,1],][,c[,1]]),
            diag(g[s[,2],][,c[,2]])),
            g=genotypes,s=selected,c=copy,SIMPLIFY=FALSE)
        for(j in 1:2) p[[j]][i+1]<-mean(gametes[[j]])
    }
    plot(0:ngen,p[[1]],type="l",col=colors[1],lwd=2,ylim=c(0,1),
        xlab="time (generations)",ylab="f(A)")
    lines(x=0:ngen,y=p[[2]],col=colors[2],lwd=2)
    if(show.legend) legend(x="topright",legend=1:2,lty=1,col=colors,
        lwd=2,bg=make.transparent("white",0.8))
    invisible(p)
}

in which the function name, msd, stands for migration, selection, & drift. It is a relatively simple modification of another function, drift.selection, but in which individuals are swapped from one population to another at some rate. It's pretty flexible in that, for instance, we simulate things like asymmetric migration rates between populations (the function argument m should contain emigration rates), differing effective population sizes, and different genotypic selection between populations.

Here are a few of examples of how it might be used.

First, load package:

library(PopGen)
packageVersion("PopGen")
## [1] '0.9.1'

Now, genetic drift absent migration between populations:

msd(m=c(0,0),Ne=c(200,200),ngen=500) ## with NO migration

plot of chunk unnamed-chunk-3

msd(m=c(0,0),Ne=c(200,200),ngen=500)

plot of chunk unnamed-chunk-3

Next, migration but no selection:

Ne<-c(200,200)
msd(m=1/Ne,Ne=Ne,ngen=500) ## relatively low migration

plot of chunk unnamed-chunk-4

msd(m=10/Ne,Ne=Ne,ngen=500) ## relatively high migration

plot of chunk unnamed-chunk-4

Now we're ready to introduce divergent natural selection between populations.

First, for reference, absent migration:

msd(p0=c(0.25,0.75),Ne=Ne,w=list(c(1,0.95,0.9),c(0.9,0.95,1)),
    m=c(0,0),ngen=500)

plot of chunk unnamed-chunk-5

Next, with some or a lot of migration:

msd(p0=c(0.25,0.75),Ne=Ne,w=list(c(1,0.95,0.9),c(0.9,0.95,1)),
    m=1/Ne,ngen=500) ## some migration

plot of chunk unnamed-chunk-6

msd(p0=c(0.25,0.75),Ne=Ne,w=list(c(1,0.95,0.9),c(0.9,0.95,1)),
    m=10/Ne,ngen=500) ## lots of migration

plot of chunk unnamed-chunk-6

Finally, what happens when one population is much larger than the other?

msd(p0=c(0.25,0.75),Ne=c(100,1000),w=list(c(1,0.95,0.9),c(0.9,0.95,1)),
    m=1/500,ngen=500,show.legend=F)
legend(x="topright",legend=c(expression(paste(N[e],"= 100")),
    expression(paste(N[e],"= 1,000"))),lty=1,col=c("red","blue"), 
    lwd=2,bg=phytools::make.transparent("white", 0.8))

plot of chunk unnamed-chunk-7

Cool.