Saturday, June 29, 2013

phytools page down again - new version of phytools submitted to CRAN

The phytools page is having problems again. This is a UMass-Boston server-wide issue, so there is not much I can do about it unfortunately (aside from complain to the system administrator). To make all the recent updates to the phytools package available to all users, however, I have just submitted a new version of phytools to CRAN. Hopefully this version is accepted and made available via the CRAN mirrors as well as in binary form soon.

Some updates in this version over the previous CRAN release (phytools 0.2-80) include the following:

1. A new function to add a legend to a plotted stochastic map tree (add.simmap.legend).

2. A new version of plotSimmap that sets the environmental variable "lastplot.phylo" to be compatible with ape functions nodelabels, tiplabels, and edgelabels.

3. A new version of findMRCA that can also (optionally) return the height above the root of the MRCA of a pair of taxa.

4. A robust Newick tree reader that can handle singleton nodes, if present.

5. A bug fix in brownieREML.

6. A new function (collapse.to.star) that collapses specified subtrees into a star tree, while retaining the same total height above the root for each tip.

7. New versions of the phytools 3D functions phylomorphospace3d and fancyTree(...,type="traitgram3d") that work a little better with the functions of rgl (described here).

8. User control of tip & internal node sizes in phylomorphospace..

9. A hacky work-around fix for the problem of attaching a new tip separated from an existing tip by zero lenth using bind.tip.

10. Finally, today, a fix to the broken function evol.vcv, which is the function implementing the method of Revell & Collar (2009).

Hopefully this new phytools update is accepted and posted to CRAN soon.

Friday, June 28, 2013

Upper triangle of a matrix to a vector by row

Say we want to get a square matrix into a vector. We can do:

to.upper<-function(X) X[upper.tri(X,diag=TRUE)]
but this will give us our upper triangular matrix as a vector by column, i.e.:
> X
       [,1]   [,2]   [,3]   [,4]   [,5]
[1,] -0.329 -0.825 -0.906  0.834  0.702
[2,]  1.195 -0.237 -1.132 -0.827  0.150
[3,] -0.097 -1.270 -1.397  0.450  0.791
[4,]  0.883 -0.574  1.538 -2.632  0.135
[5,]  1.993 -0.520 -0.071  0.094 -0.064
> to.upper(X)
[1] -0.329 -0.825 -0.237 -0.906 -1.132 -1.397  0.834 -0.827  0.450 -2.632  0.702  0.150  0.791  0.135 -0.064

If we want to get our upper triangular matrix as a vector by row (as I did), we can use:

to.upper<-function(X) t(X)[lower.tri(X,diag=TRUE)]
which works just as we'd hoped, i.e.:
> X
       [,1]   [,2]   [,3]   [,4]   [,5]
[1,] -0.329 -0.825 -0.906  0.834  0.702
[2,]  1.195 -0.237 -1.132 -0.827  0.150
[3,] -0.097 -1.270 -1.397  0.450  0.791
[4,]  0.883 -0.574  1.538 -2.632  0.135
[5,]  1.993 -0.520 -0.071  0.094 -0.064
> to.upper(X)
[1] -0.329 -0.825 -0.906  0.834  0.702 -0.237 -1.132 -0.827  0.150 -1.397  0.450  0.791 -2.632  0.135 -0.064

(Note that if we have a symmetric matrix than the upper triangular matrix by row & the lower triangular matrix by column are the same. Here I used a non-symmetric square matrix so that we could tell these apart.)

phytools page temporarily down

The phytools page is temporarily down. This seems to be a server-wide issue and is thus not my fault - hopefully this will be fixed in the morning.

Thursday, June 27, 2013

Fix for bind.tip

At this year's Evolution meeting it was reported to me that bind.tip has some weird behavior if you try and attach a tip to the end of a terminal edge. One might want to do this if, say, identical haplotypes were removed for inference - and then one wanted to add them back in for plotting.

Here's a demo of the problem:

> tree<-pbtree(n=20)
> plotTree(tree,setEnv=TRUE,offset=0.7)
setEnv=TRUE is experimental. please be patient with bugs
> tiplabels()
> aa<-bind.tip(tree,"t21",where=1,position=0)
> plotTree(aa,setEnv=TRUE,offset=0.7)
setEnv=TRUE is experimental. please be patient with bugs
> tiplabels()

Holy cow! Weird, right? Instead of binding our new tip zero-length below the tip node, bind.tip is replacing the tip label of our target terminus! Note that this will not happen even if we add the the new tip just below the target tip.

In this case, bind.tip actually just wraps around the ape function bind.tree which attaches two trees together.

I have built a work-around into the latest version of bind.tip (source code now here). This is also in a new build of phytools (phytools 0.2-89). Let's verify that this works:

> require(phytools)
Loading required package: phytools
> packageVersion("phytools")
[1] ‘0.2.89’
> bb<-bind.tip(tree,"t21",where=1,position=0)
> plotTree(bb,setEnv=TRUE,offset=0.7)
setEnv=TRUE is experimental. please be patient with bugs
> tiplabels()
> bb$edge.length
[1] 0.49852021 0.90133001 0.63759396 0.36295139 0.00000000 0.00000000 ....

This fix is a bit of a hack - but at least it works.

Wednesday, June 26, 2013

User control of node sizes in phylomorphospace

A phytools user requests:

Is there a way to turn off the internal nodes in the phylomorphospace function in phytools?

I decided to interpret this more generally as a request for user control over the size of the plotted points at terminal and internal nodes in a phylomorphospace (that is, a bivariate projection of the tree into morphospace) plot.

This was easy enough to add and is now an optional argument in the phylomorphospace function. Point size is controlled using the cex argument in points - which adjusts the plotted point size relative to the default (1.0). Code for the new version is here and I also posted a new phytools build (phytools 0.2-88) containing this update.

Here's a demo, using the original request above:

> require(phytools)
Loading required package: phytools
> packageVersion("phytools")
[1] ‘0.2.88’
> tree<-pbtree(n=30)
> X<-fastBM(tree,nsim=2)
> layout(matrix(c(1,2),1,2))
> plotTree(tree,mar=c(3.2,0.1,1.4,0.1))
> par(mar=c(4.1,4.1,2.1,0.5))
> phylomorphospace(tree,X,node.size=c(0,1.3),lwd=2, xlab="x",ylab="y",xlim=c(-4.2,2.2))
(Full resolution.)

Monday, June 24, 2013

New versions of phytools 3D methods

In my Evolution 2013 meeting talk (which I will put online soon), I showed a couple of old 3D visualization methods: a three-dimensional projection of the tree into morphospace ("phylomorphospace"); and a 3D traitgram visualization method in which x & y are phenotypic trait axes, while z represents the time since the root.

To make the plots I made a few minor updates to the two functions in which these methods are implemented: phylomorphospace3d and fancyTree(...,type="traitgram3d"). These updates are in a new phytools version (phytools 0.2-87). Here's a quick demo of how to create these as .gifs:

> require(phytools)
Loading required package: phytools
> packageVersion("phytools")
[1] ‘0.2.87’
> # simulate tree & data
> tree<-pbtree(n=40)
> X<-fastBM(tree,nsim=3)
> # create 3D phylomorphospace
> xx<-phylomorphospace3d(tree,X)
> movie3d(xx,duration=20,dir=".",movie= "phylomorphospace3d")
Will create: ./phylomorphospace3d.gif
Executing: convert -delay 1x10 phylomorphospace3d*.png phylomorphospace3d.gif
Deleting frames.
> # create 3D traitgram
> xx<-fancyTree(tree,type="traitgram3d",X=X[,1:2])
> movie3d(xx,duration=20,dir=".",movie="traitgram3d")
Will create: ./traitgram3d.gif
Executing: convert -delay 1x10 traitgram3d*.png traitgram3d.gif
Deleting frames.

That's it for now.

Sunday, June 23, 2013

Function to collapse some subtrees into a star - while retaining the same total height of the tips

The following was recently requested via the R-sig-phylo mail list serve:

I'd like to collapse the descendants of a node, identified using something like node <- mrca(tree)["A", "B"]. I did not see a function in ape, geiger, phyloch, or picante to do something like collapse.descendants(node). Is there a package with a function like this?

This can be pretty easily done using the functions of phytools. Here's a little function to do this:

function(tree,node){
 tt<-splitTree(tree,split=list(node=node,bp=
  tree$edge.length[which(tree$edge[,2]==node)]))
 ss<-starTree(species=tt[[2]]$tip.label,branch.lengths=
  diag(vcv(tt[[2]])))
 ss$root.edge<-0
 tree<-paste.tree(tt[[1]],ss)
 return(tree)
}

And here is a quick demo:

> tree<-pbtree(n=50,scale=1)
> plotTree(tree,node.numbers=T,fsize=0.8)
> tree<-collapse.to.star(tree,fastMRCA(tree,"t7","t12"))
> tree<-collapse.to.star(tree,fastMRCA(tree,"t50","t18"))
> plotTree(tree,node.numbers=T,fsize=0.8)

Cool. That did exactly what we wanted tit to do. Note that every time we collapse a subtree, the node numbers of the tree will change - so we cannot use the node numbers from the original tree to collapse multiple subtrees (we need to recompute the target node each time).

Monday, June 17, 2013

Getting a list of all sets of tips separated by zero length (or a distance less than some arbitrary value)

An R-sig-phylo user asks:

Is there a way to detect and list all tips of a tree with 0 length in their terminal branches (essentially duplicated sequences)? Would also be great if it's possible to output them in groups so that it's clear which tips are identical to which.

I answered the first part as follows:

I would advise setting some "tolerance" value, below which you consider a terminal edge to be zero. Then try:

tol<-1e-8
x<-na.omit(tree$tip.label[tree$edge[tree$edge.length<= tol,2]])
attr(x,"class")<-NULL
attr(x,"na.action")<-NULL

This works great for the first part - the only problem is that it ignores the second part by not telling us what tips are separated by tol or less distance from which other tips.

Here is a solution that addresses that:

D<-cophenetic(tree)
tol<-1e-12 # say
x<-apply(D,1,function(x) names(which(x<=tol)))
x<-unique(x)
x<-x[sapply(x,length)>1]

Let's take the following tree:

and try it out:
> require(ape)
Loading required package: ape
> D<-cophenetic(tree)
> tol<-1e-12 # say
> x<-apply(D,1,function(x) names(which(x<=tol)))
> x<-unique(x)
> x<-x[sapply(x,length)>1]
> x
[[1]]
[1] "t9" "t11"

[[2]]
[1] "t10" "t12" "t13"

[[3]]
[1] "t3" "t14"

[[4]]
[1] "t6" "t17"

[[5]]
[1] "t1" "t18" "t19"

Cool - it works.

Thursday, June 13, 2013

Common error in contMap

This is a commonly reported error from the function contMap:

contMap : Error in while (x > trans[i]) { : missed value TRUE / FALSE is required

I believe this is usually due to branches of zero length in the tree. For internal branches of zero length, this can be resolved using:

tree<-di2multi(tree)

Bug fix in brownieREML

A phytools user recently reported discrepant results between brownie.lite and brownieREML.** Both functions fit the multi-rate Brownian evolution model of O'Meara et al. (2006), the former using ML and the latter REML. To fit the model using REML we scale the branches & branch segments of the tree by the rate, and then we compute contrasts and maximize the probability of the contrasts given the rate parameters in our model.

(**Note that brownie.lite & brownieREML are not expected to give exactly the same results. REML should be unbiased, whereas ML is only asymptotically unbiased and will be slightly downwardly biased for small samples. That being said, the results should be quite similar for reasonable sample sizes in each rate regime.)

The bug is that the the order of the data in the input vector x need to be in the order of tree$tip.label, but this is not noted in the documentation and the function does not return an error if this is not the case. Oops.

OK, this has been fixed in the latest version of brownieREML. I have also improved the function code (which dates to the early days of phytools) so that it is a little cleaner.

This update, along with the totally new version of read.newick, are in a new non-CRAN build of phytools (phytools 0.2-84). Please keep the bug reports coming!

Friday, June 7, 2013

Robust Newick tree reader

phytools has a function to read simple Newick format trees (called read.newick). This function has been totally useless because it is completely redundant with read.tree in the 'ape' package. However a recent query on the R-sig-phylo email list got me wondering if there was any reason that the code from my recent major rewrite of read.simmap couldn't be harvested to re-write read.newick as a "robust" tree reader that can accept singleton nodes, etc.

First off - what is a singleton node. Most nodes in our tree have two or more descendants. A singleton node is a node with only one descendant. These are created by extra left & right parentheses in our Newick string. For example:

(((A,B),(C,D)),E);
has no singletons; whereas:
((((A),B),(C,D))),E);
has two singletons - one on the edge leading from the common ancestor of A & B to tip A, and another below the clade containing A, B, C, and D.

The code for my robust tree reader is here. Let's try to use read.tree and read.newick to read in the two trees above:

> # load source
> source("read.newick.R")
>
> # read tree
> aa<-"(((A,B),(C,D)),E);"
> t1<-read.tree(text=aa)
> t2<-read.newick(text=aa)
>
> # plot
> par(lend=2) # for plotting
> par(mar=c(0.1,0.1,3.1,0.1))
> layout(matrix(c(1,2),1,2))
> plot(t1,edge.width=3,lend=2)
> title("read.tree")
> plot(t2,edge.width=3,lend=2)
> title("read.newick")
> bb<-"((((A),B),(C,D))),E);"
> t3<-read.tree(text=bb)
Error in if (sum(obj[[i]]$edge[, 1] == ROOT) == 1 && dim(obj[[i]]$edge)[1] > :
missing value where TRUE/FALSE needed
> t4<-read.newick(text=bb)
> layout(matrix(c(2,1),1,2))
> plot(t4,edge.width=3,lend=2)
Error in plot.phylo(t4, edge.width = 3, lend = 2) :
there are single (non-splitting) nodes in your tree; you may need to use collapse.singles()
> t4<-collapse.singles(t4)
> plot(t4,edge.width=3,lend=2)
> title("read.newick")

That's it.

Thursday, June 6, 2013

Overlaying a posterior density map from stochastic mapping on your phylomorphospace

Thinking about phylomorphospaces for the first time in a bit last night, when I realized that we can now use phytools to pretty easily overlay a posterior density map from stochastic mapping (e.g., here) onto a projection of the tree into two dimensional morphospace - i.e., a phylomorphospace plot (e.g., here). This is how we do it.

First, for the purposes of demonstration, let's simulate some data with a high rate & correlation between x & y when our simulated discrete character is in the derived state '1', and a low rate & correlation when in the ancestral state '0':

> # simulate tree & data
> Q<-matrix(c(-1,1,1,-1),2,2)
> rownames(Q)<-colnames(Q)<-c(0,1)
> tree<-sim.history(pbtree(n=40,scale=1),Q,anc="0")
> R<-list(matrix(c(1,0,0,1),2,2),matrix(c(2,1.8,1.8,2), 2,2))
> names(R)<-c(0,1)
> X<-sim.corrs(tree,R)
> colnames(X)<-c("x","y")

Next, let's conduct empirical Bayes stochastic mapping & then generate a posterior density map:

> # Ok, now do stochastic character mapping
> mtrees<-make.simmap(tree,tree$states,nsim=100, message=FALSE)
> # densityMap
> dmap<-densityMap(mtrees)
sorry - this might take a while; please be patient

Finally, let's overlay the density map on our phylomorphospace plot:

> phylomorphospace(dmap$tree,X,colors=dmap$cols, node.by.map=TRUE,xlim=c(-1.7,2))
> add.simmap.legend(colors=setNames(c(dmap$cols[1], dmap$cols[length(dmap$cols)]),c(0,1)))
Click where you want to draw the legend

Pretty cool.

Even simpler phylomorphospace

As I mentioned yesterday, I'm working a book chapter on PCM visualization methods. A very small section of that chapter gives an introduction to programming such methods in R. To that end I described a simplified tree plotting function. Here is code for a simplified phylomorphospace plotting function. It needs phytools (and dependencies) and calibrate.

simplePhylomorphospace<-function(tree,x,y){
  n<-length(tree$tip.label)
  # get the x & y coordinates of all the tips & nodes
  x<-c(x[tree$tip.label],fastAnc(tree,x))
  y<-c(y[tree$tip.label],fastAnc(tree,y))
  # plot tips
  plot(x[1:n],y[1:n],cex=1.25,pch=21,bg="black",xlab="x",
   ylab="y")
  # plot nodes
  points(x[1:tree$Nnode+n],y[1:tree$Nnode+n],cex=1,pch=21,
   bg="black")
  # plot lines
  apply(tree$edge,1,function(edge,x,y) lines(x[edge],
   y[edge]),x=x,y=y)
  # add tip labels (requires 'calibrate')
  textxy(x[1:n],y[1:n],tree$tip.label)
}
(Just seven lines of code, excluding comments.)

Let's see how it works:

> require(phytools)
Loading required package: phytools
> require(calibrate)
Loading required package: calibrate
> source("simplePhylomorphospace.R")
> tree<-pbtree(n=30)
> x<-fastBM(tree)
> y<-fastBM(tree)
> simplePhylomorphospace(tree,x,y)

Wednesday, June 5, 2013

Simple tree plotter

As I mentioned in a prior post I am writing a book chapter on visualization for phylogenetic comparative biology. As I component of this, I discuss the basics of plotting a couple of different types of phylogenetic trees, including some instruction on programming these methods.

For one component of this I wrote a simplified tree plotting function in R. This is what it looks like. Excluding annotation, the function code is less than 20 lines:

simpleTreePlot<-function(tree){
  n<-length(tree$tip.label)
  # reorder cladewise to assign tip positions
  cw<-reorder(tree,"cladewise")
  y<-vector(length=n+cw$Nnode)
  y[cw$edge[cw$edge[,2]<=n,2]]<-1:n
  # reorder pruningwise for post-order traversal
  pw<-reorder(tree,"pruningwise")
  nn<-unique(pw$edge[,1])
  # compute vertical position of each edge
  for(i in 1:length(nn)){
    yy<-y[pw$edge[which(pw$edge[,1]==nn[i]),2]]
    y[nn[i]]<-mean(range(yy))
  }
  # compute start & end points of each edge
  X<-nodeHeights(cw)
  # open & size a new plot
  plot.new(); par(mar=rep(0.1,4))
  plot.window(xlim=c(0,1.1*max(X)),ylim=c(0,max(y)+1))
  # plot horizontal edges
  for(i in 1:nrow(X))
    lines(X[i,],rep(y[cw$edge[i,2]],2),lwd=2,lend=2)
  # plot vertical relationships
  for(i in 1:tree$Nnode+n)
    lines(X[which(cw$edge[,1]==i),1],
    range(y[cw$edge[which(cw$edge[,1]==i),2]]),lwd=2,
    lend=2)
  # plot tip labels
  for(i in 1:n)
    text(X[which(cw$edge[,2]==i),2],y[i],tree$tip.label[i],
    pos=4,offset=0.1)
}

Try it out:

> require(phytools)
Loading required package: phytools
> tree<-pbtree(b=1,d=0.2,n=30)
> simpleTreePlot(tree)

Any suggestions?

Tuesday, June 4, 2013

New version of findMRCA

I just posted a new version of findMRCA. This function finds the most recent common ancestor (MRCA) for a set of taxa. Now it can instead (optionally) return the height above the root of the MRCA of a set of taxa.

This version is in a new phytools build (phytools 0.2-83), which many users will be able to download & install from source.

This update is mainly to address the need of a phytools user. The previous version worked fine, so far as I know.

Monday, June 3, 2013

plotSimmap(...,type="phylogram") now compatible with nodelabels() in ape

I have just posted a new version of the phytools function plotSimmap (and a new phytools package version, phytools 0.2-82) that can be compatible with the ape functions nodelabels, edgelabels, and tiplabels. This is accomplished by setting the environmental variable "lastplot.phylo" in the environment .PlotEnvPhylo following the ape convention. This environmental variable is a list containing all the information used by nodelabels and similar to identify the location of nodes in the current plotting window.

This is a little experimental - but let's try it out:

> # tree is a stochastic map for the anole
> # ecomorph tree
> plotSimmap(tree,pts=FALSE,lwd=3,fsize=0.7,setEnv=TRUE)
no colors provided. using the following legend:
      CG        GB        TC        TG        Tr        TW
  "black"    "red"  "green3"    "blue"    "cyan" "magenta"
setEnv=TRUE is experimental. please be patient with bugs
> nodelabels(cex=0.7)

We can also do leftward facing trees:

> plotSimmap(tree,pts=FALSE,lwd=3,fsize=0.7,setEnv=TRUE, direction="leftwards")
no colors provided. using the following legend:
      CG        GB        TC        TG        Tr        TW
  "black"    "red"  "green3"    "blue"    "cyan" "magenta"
setEnv=TRUE is experimental. please be patient with bugs
> nodelabels(cex=0.7)

One handy use of this might be to plot the posterior probabilities of each node as a pie chart on top of one example stochastic map. (I coerced nodelabels into doing that here, but this is much neater.) For example:

> # trees is 100 stochastically mapped trees
> # get the posterior probs from our sample
> PP<-describe.simmap(trees,message=FALSE)$ace
> # let's leave space for a legend
> plot.new(); par(mar=rep(0.1,4))
> par(usr=c(-0.04,1.04,-5,1.04*length(tree$tip.label)))
> # set colors
> cols<-setNames(palette()[1:6],sort(unique(getStates(tree,"tips"))))
> # plot
> plotSimmap(tree,cols,lwd=2,pts=FALSE,add=TRUE,fsize=0.7, setEnv=TRUE)
setEnv=TRUE is experimental. please be patient with bugs
> nodelabels(pie=PP,piecol=palette()[1:6],cex=0.6)
> add.simmap.legend(colors=cols,vertical=FALSE)
Click where you want to draw the legend
Click for larger version.

That's pretty cool, I think.

On the annoying task of adding a legend to a plotted stochastic mapping tree

Today (actually yesterday, now) - in part because I've committed to writing this book chapter on plotting comparative data - I undertook the task of figuring out how to add a color legend to a plotted stochastic mapped tree.

The idea sounds simple enough. We basically want to plot two things: boxes filled according to our translation table from state to color on the stochastic mapped tree; and labels for each of those boxes. We just need to figure out how to space the boxes and the labels so that the result looks good reliably and so the legend is easy enough to consume.

This is complicated by the different places to which we might like to add our legend. So, for instance - in circular trees (type="fan") it probably makes sense to have a vertical legend - filling the whitespace in any of the four corners of the plot. By contrast - in a square right or left facing phylogram (type="phylogram") it probably makes sense to have a horizontal legend.

This is not in phytools yet as I'm working out the kinks, but here is my add-legend code:

add.simmap.legend<-function(leg=NULL,colors,prompt=TRUE, vertical=TRUE,...){
  if(prompt){
    cat("Click where you want to draw the legend\n")
    x<-unlist(locator(1))
    y<-x[2]
    x<-x[1]
  } else {
    if(hasArg(x)) x<-list(...)$x
    else x<-0
    if(hasArg(y)) y<-list(...)$y
    else y<-0
  }
  if(hasArg(fsize)) fsize<-list(...)$fsize
  else fsize<-1.0
  if(is.null(leg)) leg<-names(colors)
  h<-fsize*strheight(leg[1])
  w<-h*(par()$usr[2]-par()$usr[1])/(par()$usr[4]-
   par()$usr[3])
  if(vertical){
    y<-y-0:(length(leg)-1)*1.5*h
    x<-rep(x+w/2,length(y))
    symbols(x,y,squares=rep(w,length(x)),bg=colors,
     add=TRUE,inches=FALSE)
    text(x+w,y,leg,pos=4,cex=fsize)
  } else {
    sp<-fsize*max(strwidth(leg))
    x<-x-w/2+0:(length(leg)-1)*1.5*(sp+w)
    y<-rep(y+w/2,length(x))
    symbols(x,y,squares=rep(w,length(x)),bg=colors,
     add=TRUE,inches=FALSE)
    text(x,y,leg,pos=4,cex=fsize)
  }
}

I decided that I would use boxes of height & width equal to the legend labels, which I can compute using strheight. However things got slightly complicated when I realized that because symbols(...,squares) takes the symbol side length in the x axis units, I would have to first translate between x & y units as follows:

h<-fsize*strheight(leg[1])
w<-h*(par()$usr[2]-par()$usr[1])/(par()$usr[4]-
 par()$usr[3])

The final complication is the plotSimmap(...,type="phylogram") (the default) leaves literally no space for a plotted legend in the plotting window. This we can address by first creating a plotting window that is larger than would be opened by plotSimmap and then using plotSimmap(...,add=TRUE).

Ok, here's a demo:

> # load phytools
> require(phytools)
Loading required package: phytools
> packageVersion("phytools")
[1] ‘0.2.80’
> # load data for example
> data(anoletree)
> # prune to only 'ecomorph' species
> x<-getStates(anoletree,"tips")
> tree<-drop.tip.simmap(anoletree,names(x)[which(x=="Non-")])
> x<-getStates(tree,"tips")
> # do stochastic mapping
> ecomorph.trees<-make.simmap(tree,x,nsim=100,model="ER")
make.simmap is sampling character histories conditioned on the transition matrix
Q =
...
(estimated using likelihood);
and (mean) root node prior probabilities
pi =
      CG        GB        TC        TG        Tr        TW 0.1666667 0.1666667 0.1666667 0.1666667 0.1666667 0.1666667
Done.
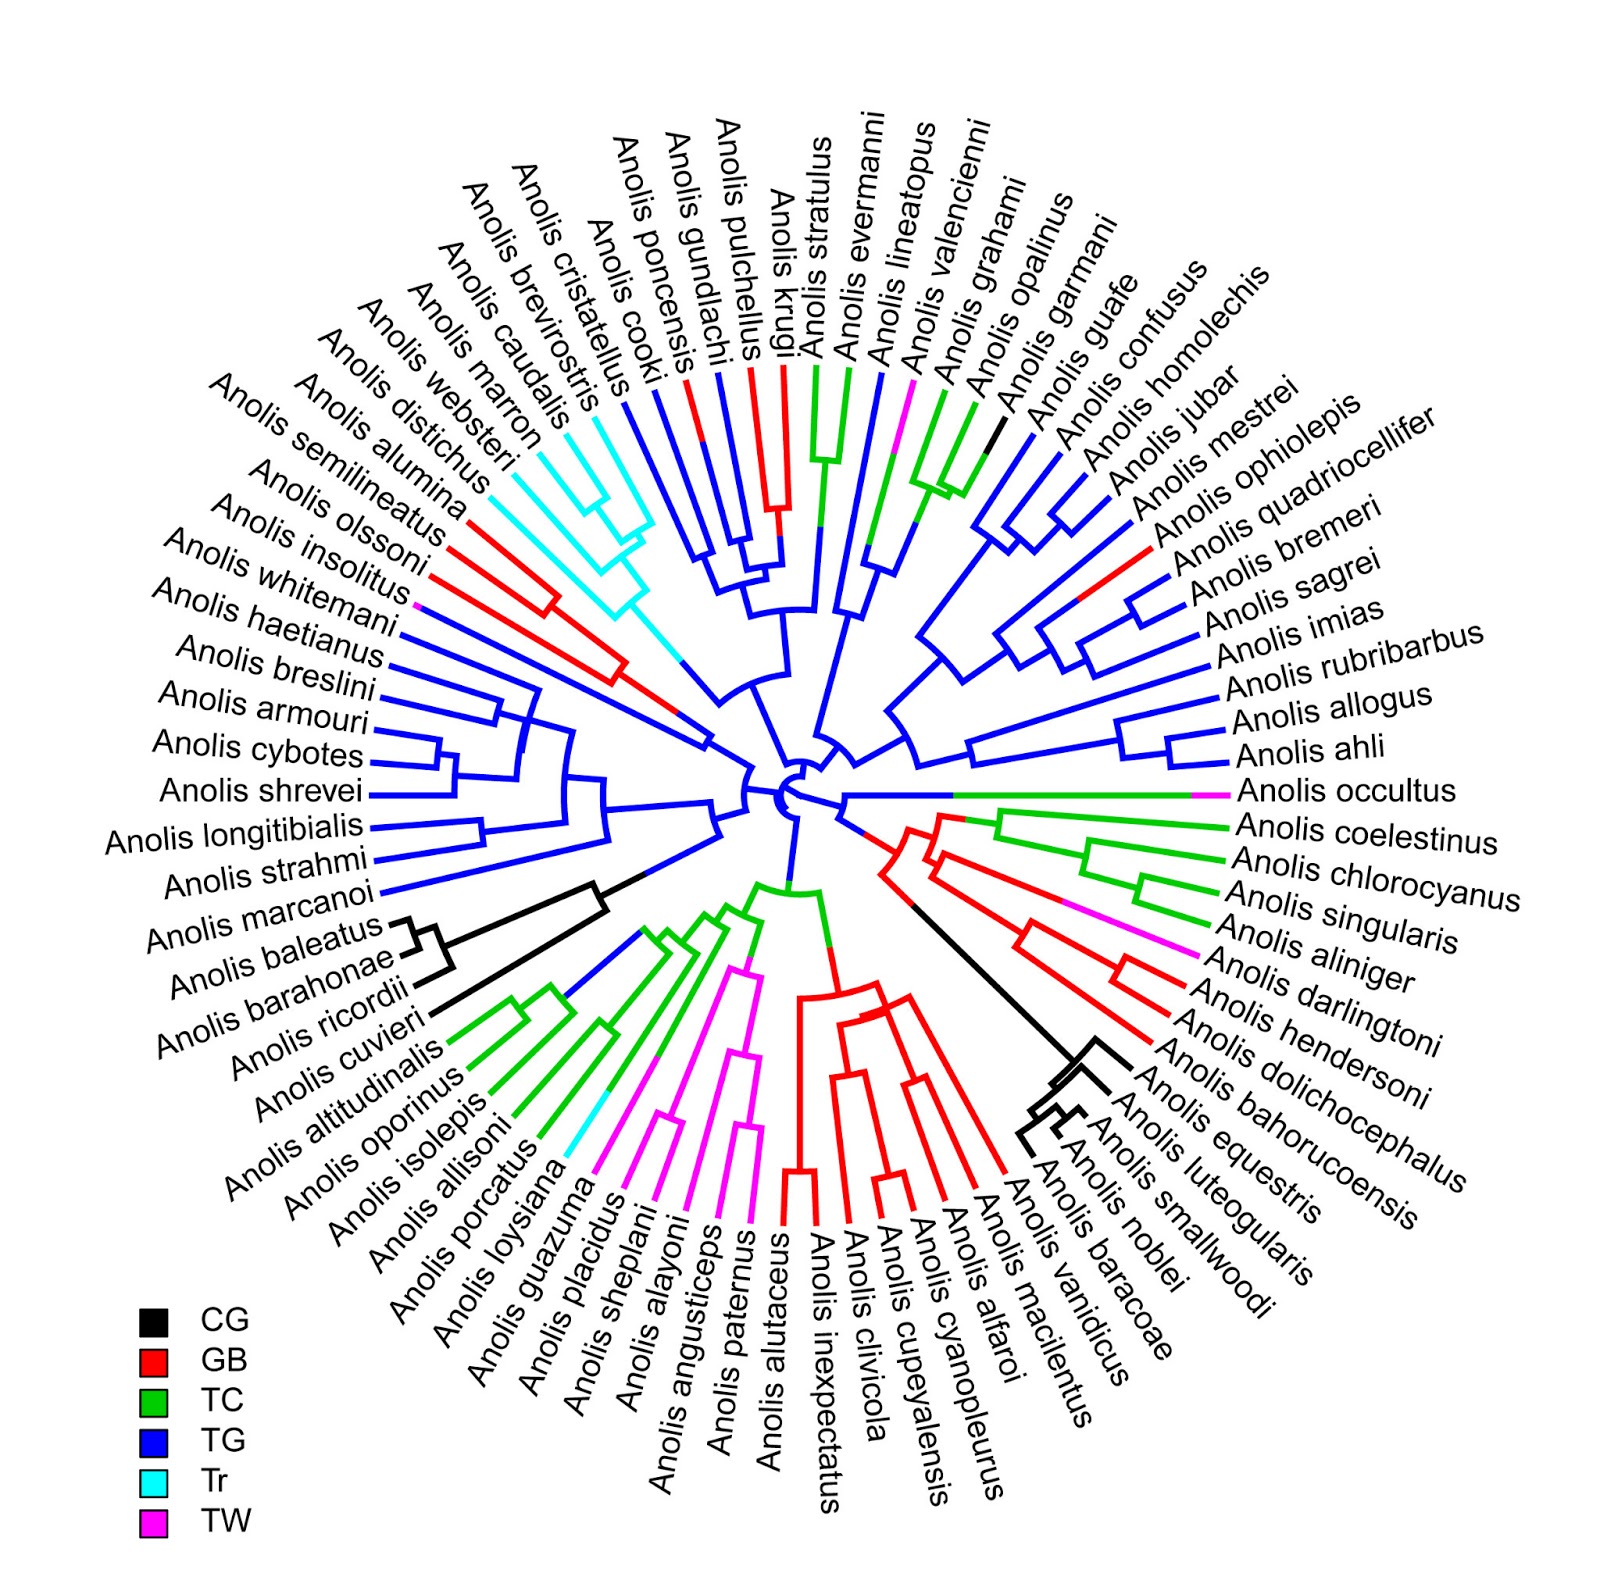
> # plot tree type="fan"
> plotSimmap(ecomorph.trees[[1]],type="fan",lwd=3)
no colors provided. using the following legend:
      CG        GB        TC        TG        Tr        TW
  "black"    "red"  "green3"    "blue"    "cyan" "magenta"

Note: type="fan" is in development.
Many options of type="phylogram" are not yet available.

> source("add.simmap.legend.R") # load source
> # add legend
> add.simmap.legend(leg=sort(unique(x)),
colors=palette()[1:6])
Click where you want to draw the legend

And now for the slightly more complicated case of plotSimmap(..., type="phylogram"):

> # first create plotting area
> plot.new(); par(mar=rep(0.1,4))
> par(usr=c(-0.04,1.04,-5,1.04*length(tree$tip.label)))
> # plot tree
> plotSimmap(ecomorph.trees[[5]],lwd=3,pts=FALSE,add=TRUE, fsize=0.7)
no colors provided. using the following legend:
      CG        GB        TC        TG        Tr        TW
  "black"    "red"  "green3"    "blue"    "cyan" "magenta"
> # finally, add legend
> colors<-setNames(palette()[1:6],sort(unique(x)))
> add.simmap.legend(colors=colors,vertical=FALSE)
Click where you want to draw the legend

That looks ok.