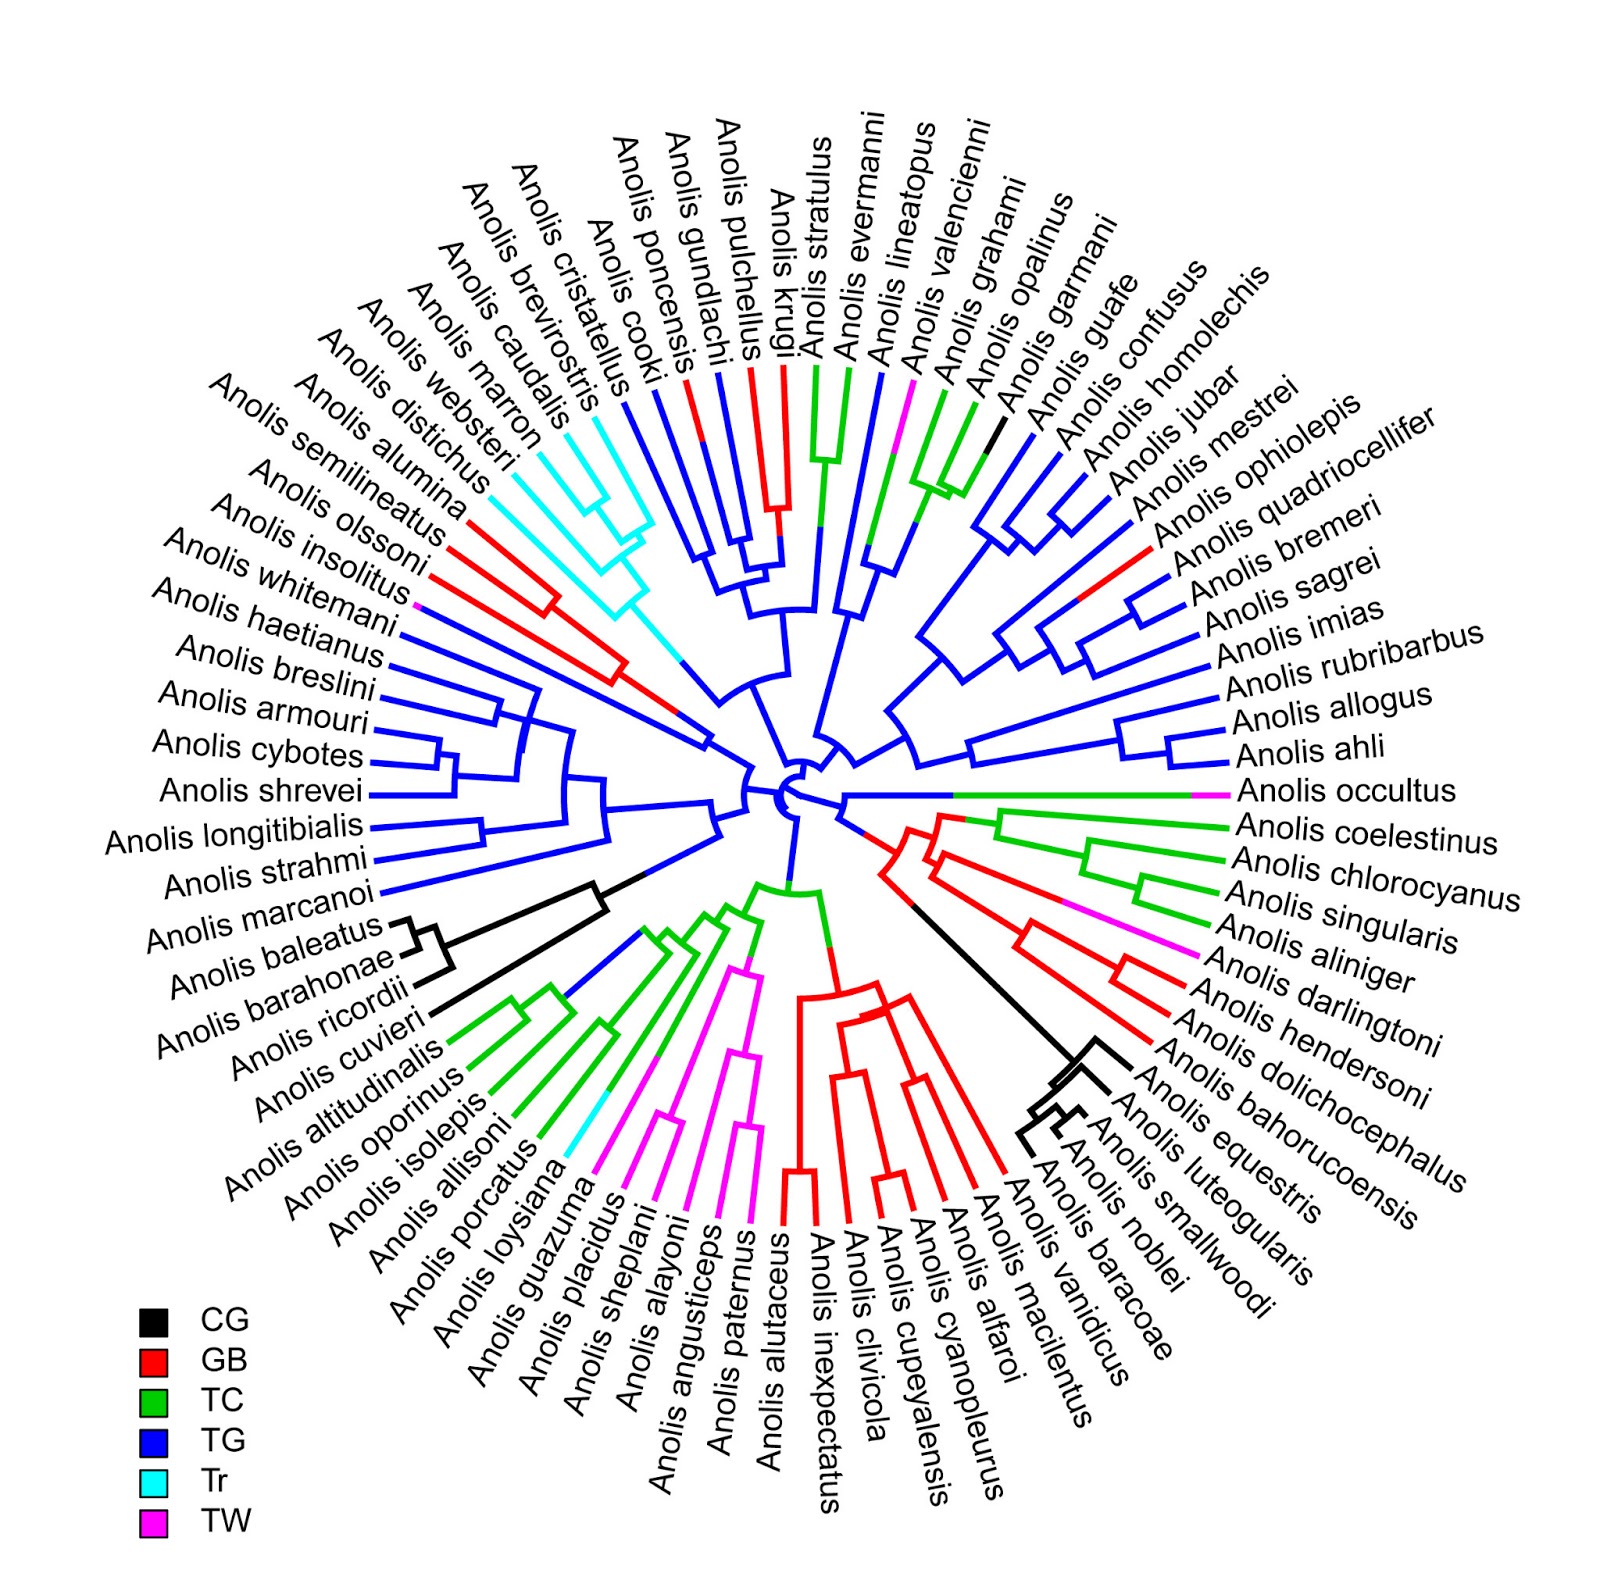
Today (actually yesterday, now) - in part because I've committed to writing this book chapter on plotting comparative data - I undertook the task of figuring out how to add a color legend to a plotted stochastic mapped tree.
The idea sounds simple enough. We basically want to plot two things: boxes filled according to our translation table from state to color on the stochastic mapped tree; and labels for each of those boxes. We just need to figure out how to space the boxes and the labels so that the result looks good reliably and so the legend is easy enough to consume.
This is complicated by the different places to which we might like to add our legend. So, for instance - in circular trees (type="fan") it probably makes sense to have a vertical legend - filling the whitespace in any of the four corners of the plot. By contrast - in a square right or left facing phylogram (type="phylogram") it probably makes sense to have a horizontal legend.
This is not in phytools yet as I'm working out the kinks, but here is my add-legend code:
if(prompt){
cat("Click where you want to draw the legend\n")
x<-unlist(locator(1))
y<-x[2]
x<-x[1]
} else {
if(hasArg(x)) x<-list(...)$x
else x<-0
if(hasArg(y)) y<-list(...)$y
else y<-0
}
if(hasArg(fsize)) fsize<-list(...)$fsize
else fsize<-1.0
if(is.null(leg)) leg<-names(colors)
h<-fsize*strheight(leg[1])
w<-h*(par()$usr[2]-par()$usr[1])/(par()$usr[4]-
par()$usr[3])
if(vertical){
y<-y-0:(length(leg)-1)*1.5*h
x<-rep(x+w/2,length(y))
symbols(x,y,squares=rep(w,length(x)),bg=colors,
add=TRUE,inches=FALSE)
text(x+w,y,leg,pos=4,cex=fsize)
} else {
sp<-fsize*max(strwidth(leg))
x<-x-w/2+0:(length(leg)-1)*1.5*(sp+w)
y<-rep(y+w/2,length(x))
symbols(x,y,squares=rep(w,length(x)),bg=colors,
add=TRUE,inches=FALSE)
text(x,y,leg,pos=4,cex=fsize)
}
}
I decided that I would use boxes of height & width equal to the legend labels, which I can compute using strheight. However things got slightly complicated when I realized that because symbols(...,squares) takes the symbol side length in the x axis units, I would have to first translate between x & y units as follows:
w<-h*(par()$usr[2]-par()$usr[1])/(par()$usr[4]-
par()$usr[3])
The final complication is the plotSimmap(...,type="phylogram") (the default) leaves literally no space for a plotted legend in the plotting window. This we can address by first creating a plotting window that is larger than would be opened by plotSimmap and then using plotSimmap(...,add=TRUE).
Ok, here's a demo:
> require(phytools)
Loading required package: phytools
> packageVersion("phytools")
[1] ‘0.2.80’
> # load data for example
> data(anoletree)
> # prune to only 'ecomorph' species
> x<-getStates(anoletree,"tips")
> tree<-drop.tip.simmap(anoletree,names(x)[which(x=="Non-")])
> x<-getStates(tree,"tips")
> # do stochastic mapping
> ecomorph.trees<-make.simmap(tree,x,nsim=100,model="ER")
make.simmap is sampling character histories conditioned on the transition matrix
Q =
...
(estimated using likelihood);
and (mean) root node prior probabilities
pi =
CG GB TC TG Tr TW 0.1666667 0.1666667 0.1666667 0.1666667 0.1666667 0.1666667
Done.
> # plot tree type="fan"
> plotSimmap(ecomorph.trees[[1]],type="fan",lwd=3)
no colors provided. using the following legend:
CG GB TC TG Tr TW
"black" "red" "green3" "blue" "cyan" "magenta"
Note: type="fan" is in development.
Many options of type="phylogram" are not yet available.
> source("add.simmap.legend.R") # load source
> # add legend
> add.simmap.legend(leg=sort(unique(x)),
colors=palette()[1:6])
Click where you want to draw the legend
And now for the slightly more complicated case of plotSimmap(..., type="phylogram"):
> plot.new(); par(mar=rep(0.1,4))
> par(usr=c(-0.04,1.04,-5,1.04*length(tree$tip.label)))
> # plot tree
> plotSimmap(ecomorph.trees[[5]],lwd=3,pts=FALSE,add=TRUE, fsize=0.7)
no colors provided. using the following legend:
CG GB TC TG Tr TW
"black" "red" "green3" "blue" "cyan" "magenta"
> # finally, add legend
> colors<-setNames(palette()[1:6],sort(unique(x)))
> add.simmap.legend(colors=colors,vertical=FALSE)
Click where you want to draw the legend
That looks ok.


"in part because I've committed to writing this book chapter on plotting comparative data"
ReplyDeleteWell, I'm looking forward to that!