 It is the final day of what was once the NESCent tutorial on Evolutionary
Quantitative Genetics but has since become the NIMBioS
tutorial on
Evolutionary Quantitative Genetics - co-organized, in all its iterations,
by Joe Felsenstein
& Steve
Arnold. For the past four years I have been a 'guest instructor' in this
program. My material for this year's edition is now finished & can be viewed
online
here and
can be seen by clicking through for the links to
Lecture
5.2: Ancestral state reconstruction,
Computer Exercise 5.2: Ancestral
state reconstruction and visual display of states, and
Computer exercise 6.1:
Threshold characters and continuous characters. Check it out! I believe video
of my lecture, and the lectures of all other workshop instructors, will also be
posted online at some point in the future & should be linked from the
course site.
It is the final day of what was once the NESCent tutorial on Evolutionary
Quantitative Genetics but has since become the NIMBioS
tutorial on
Evolutionary Quantitative Genetics - co-organized, in all its iterations,
by Joe Felsenstein
& Steve
Arnold. For the past four years I have been a 'guest instructor' in this
program. My material for this year's edition is now finished & can be viewed
online
here and
can be seen by clicking through for the links to
Lecture
5.2: Ancestral state reconstruction,
Computer Exercise 5.2: Ancestral
state reconstruction and visual display of states, and
Computer exercise 6.1:
Threshold characters and continuous characters. Check it out! I believe video
of my lecture, and the lectures of all other workshop instructors, will also be
posted online at some point in the future & should be linked from the
course site.
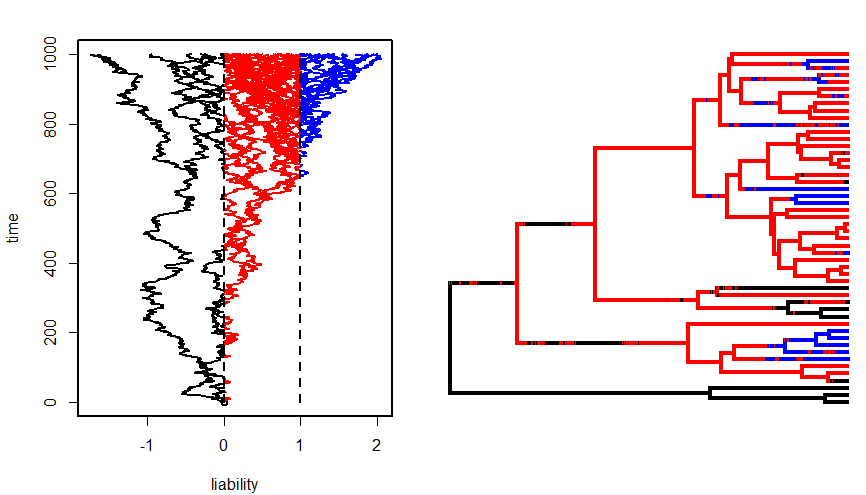
BTW, inspired by my computer exercise on threshold characters, the figure above
was produced using the phytools function bmPlot. For instance:
library(phytools)
tree<-pbtree(n=40,scale=1)
par(mfcol=c(1,2))
par(lwd=2)
par(mar=c(4.1,4.1,2.1,2.1))
obj<-bmPlot(tree,type="threshold",thresholds=c(0,1))
plotSimmap(obj$tree,colors=setNames(c("black","red","blue"),
    letters[1:3]),ftype="off",lwd=4,mar=c(4.1,0.1,2.1,0.1))

No comments:
Post a Comment
Note: due to the very large amount of spam, all comments are now automatically submitted for moderation.