I recently made a couple of small
updates
to plotSimmap - firstly, to allow user control of the line end
type (lend, as in par); and secondly, for
type="fan", to plot the two edges originating from the root as
a single segmented line.
Here is a quick example using the latest version of phytools on GitHub:
library(phytools)
packageVersion("phytools")
## [1] '0.5.59'
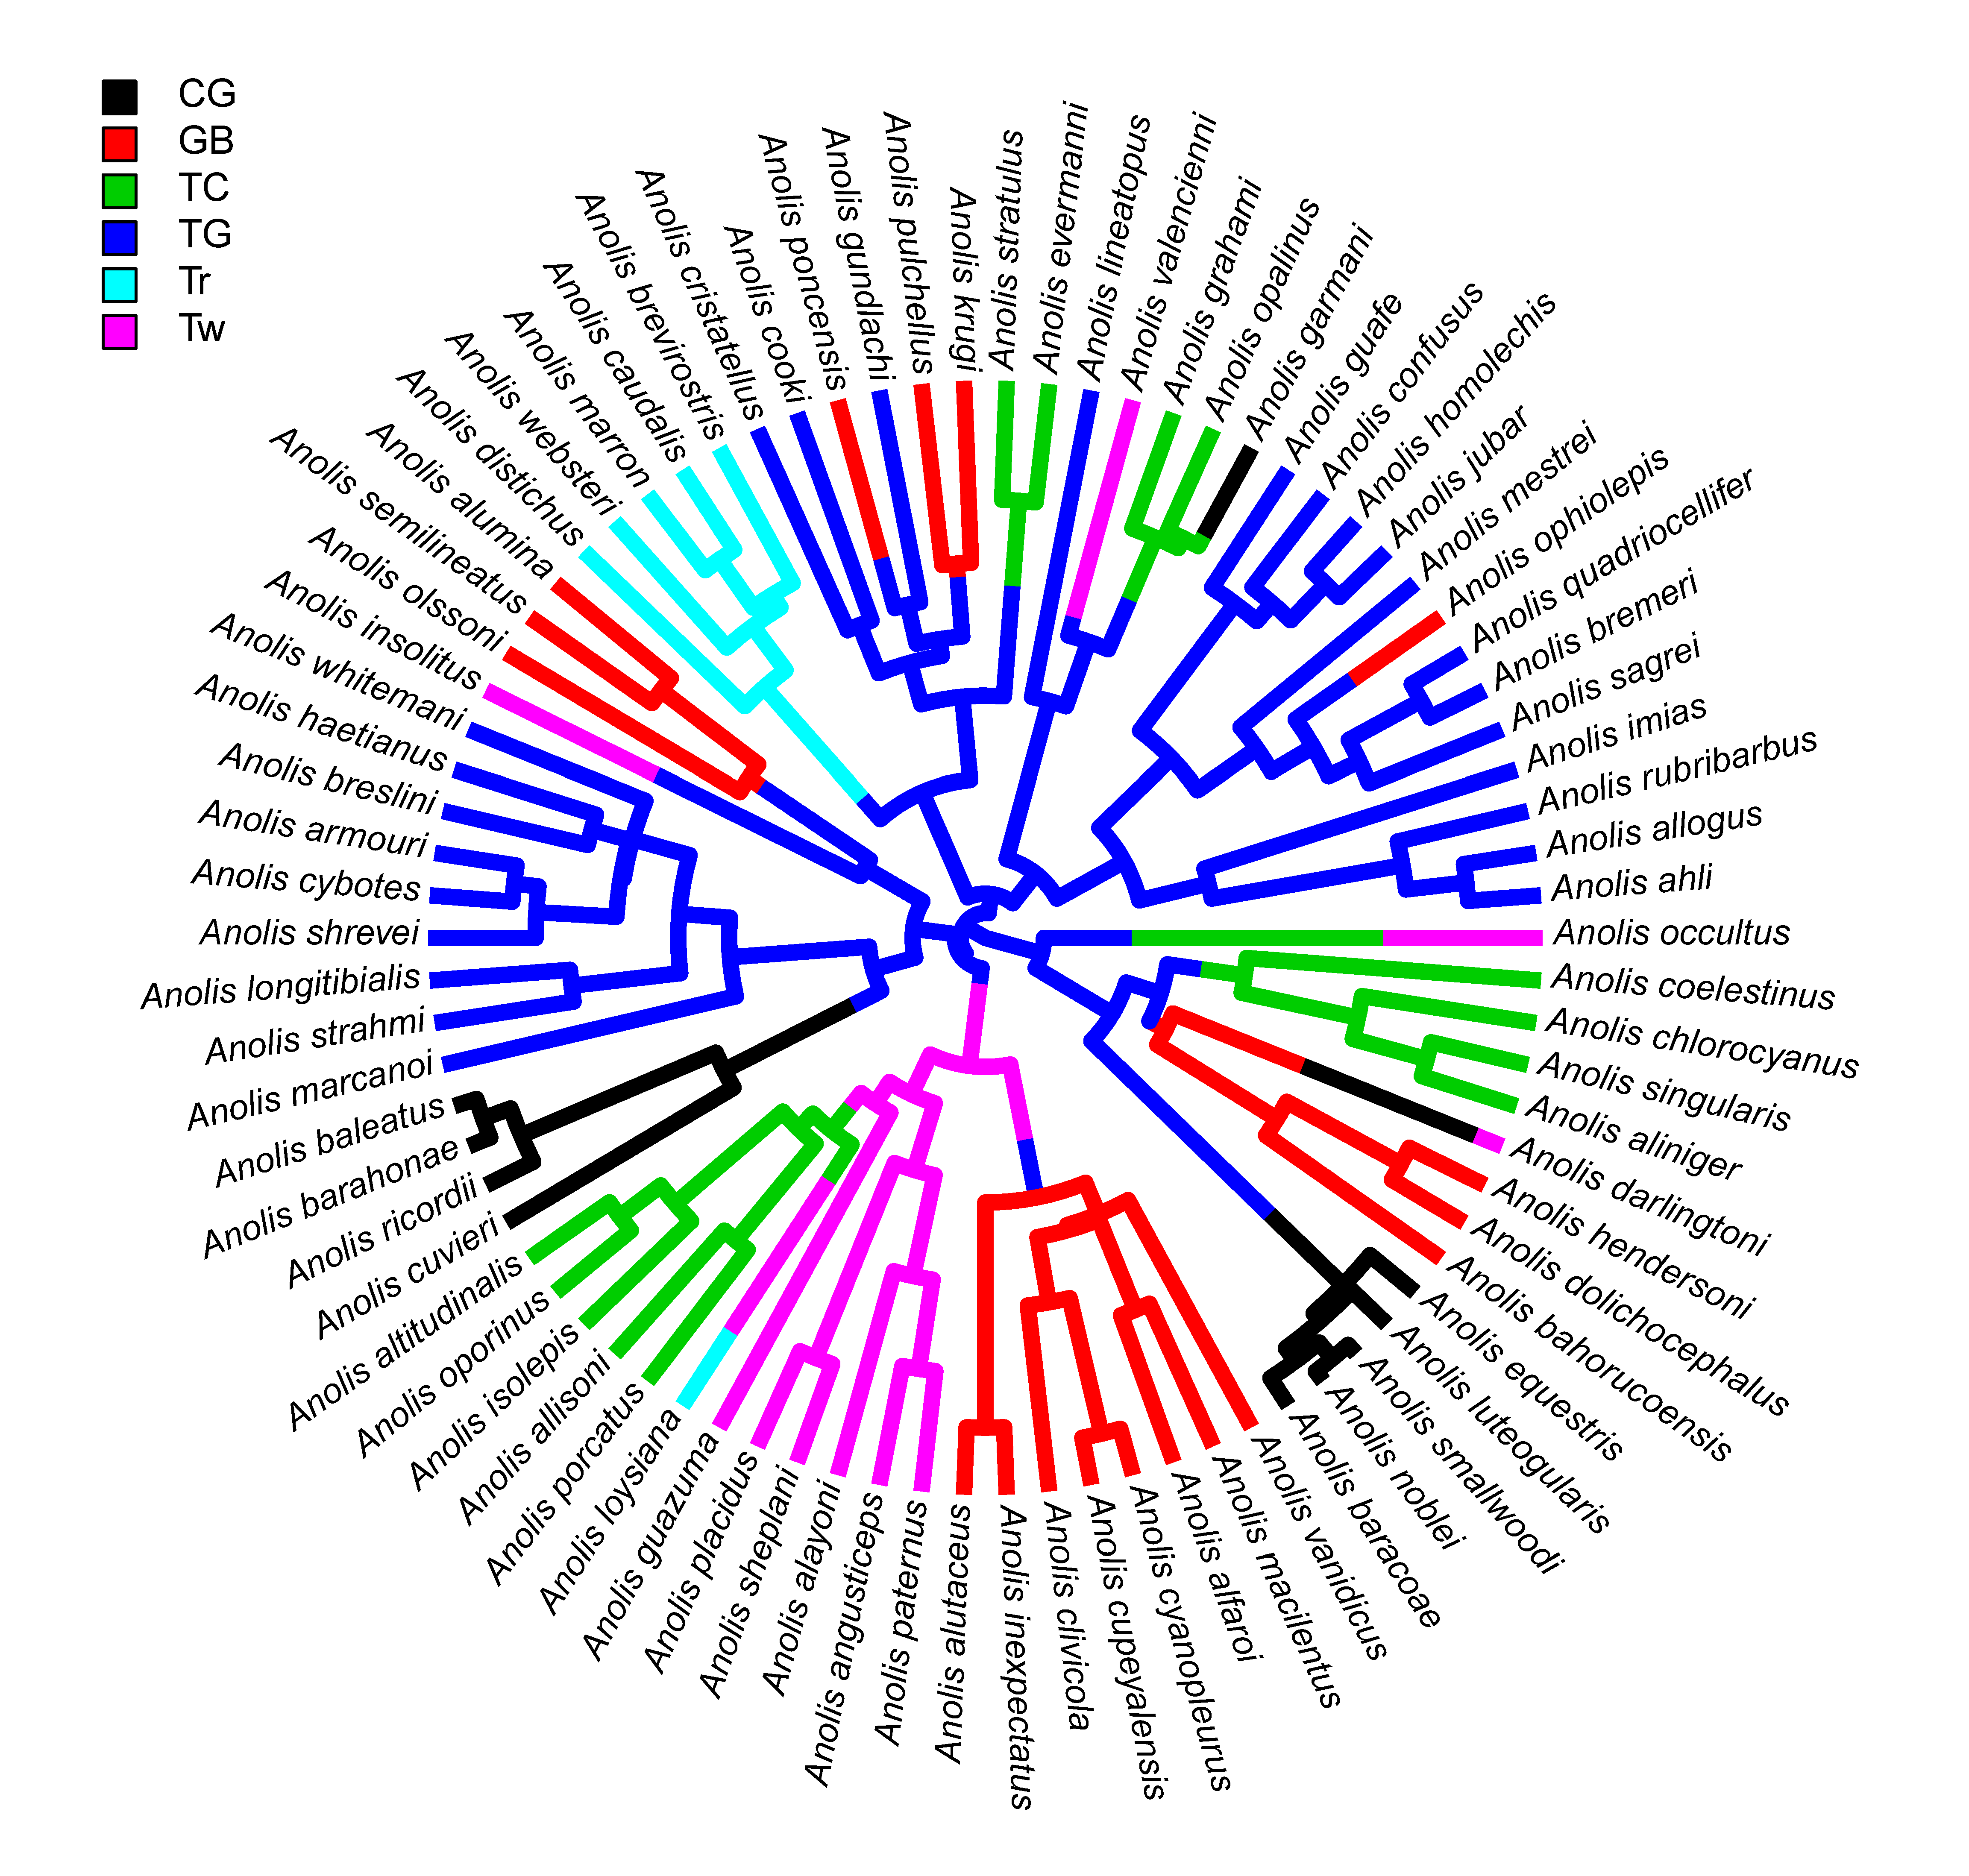
data(anoletree)
plot(anoletree,lwd=5,ftype="i",fsize=0.5)
## no colors provided. using the following legend:
##        CG        GB        TC        TG        Tr        Tw
##   "black"     "red"  "green3"    "blue"    "cyan" "magenta"

plot(anoletree,lwd=5,ftype="i",fsize=0.5,lend=0) ## curved
## no colors provided. using the following legend:
##        CG        GB        TC        TG        Tr        Tw
##   "black"     "red"  "green3"    "blue"    "cyan" "magenta"

plot(anoletree,lwd=5,ftype="i",fsize=0.5,lend=1) ## mitered
## no colors provided. using the following legend:
##        CG        GB        TC        TG        Tr        Tw
##   "black"     "red"  "green3"    "blue"    "cyan" "magenta"

Or as type="fan"
plot(anoletree,lwd=5,ftype="i",fsize=0.8,lend=1,type="fan")
## no colors provided. using the following legend:
##        CG        GB        TC        TG        Tr        Tw
##   "black"     "red"  "green3"    "blue"    "cyan" "magenta"
cols<-setNames(palette()[1:length(unique(getStates(anoletree,
    "tips")))],
    sort(unique(getStates(anoletree,"tips"))))
add.simmap.legend(colors=cols,x=0.9*par()$usr[1],
    y=0.9*par()$usr[4],prompt=FALSE,fsize=0.9)

Note that the 'pixelation' (aka. aliasing) is just an effect of the rendering and disappears if the plot is rendered as a PDF, e.g.:
Finally, the purpose of plotting the two lines originating at the root as a single segmented line is the eliminate what can be an ugly overlap of the two daughter edges when plotted separately:
plotTree(tree,type="fan",lwd=4,part=0.5,lend=1,fsize=0.5)

or:
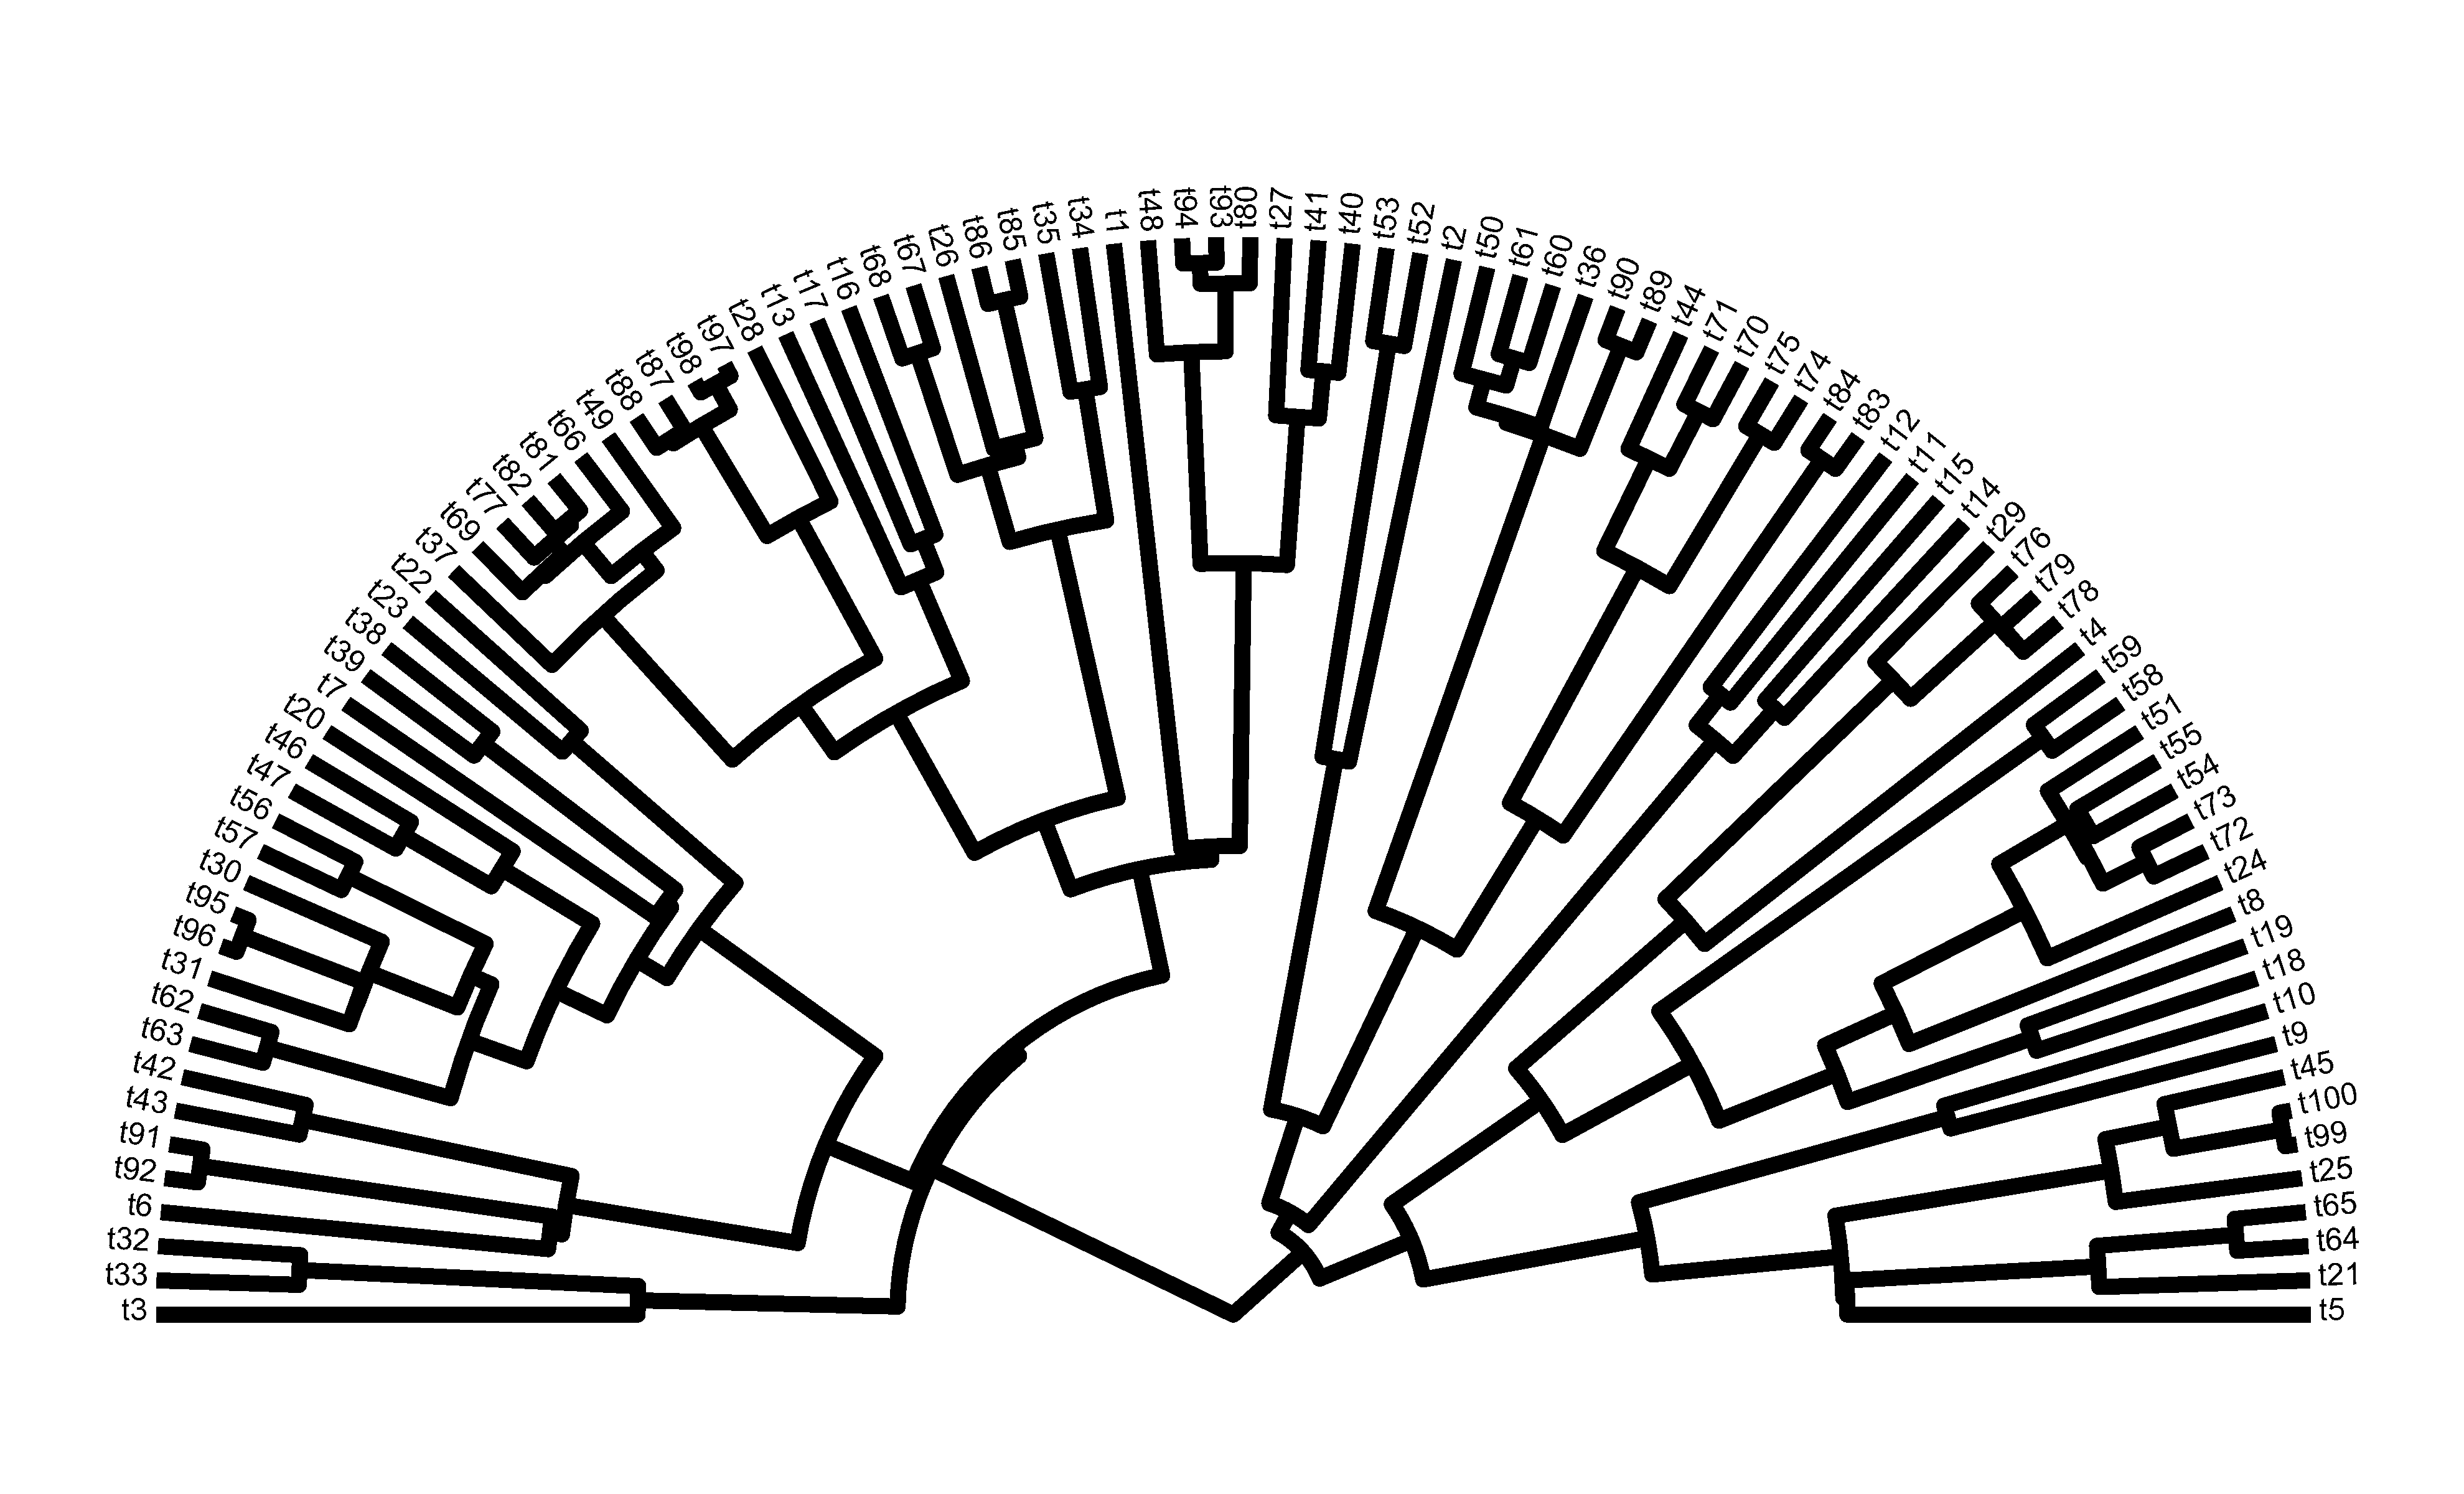
(rendered more nicely).
That's it.
Hi, Liam,
ReplyDeleteI was wondering if it is possible to input an ultrametric tree to a make.simmap function for stochastic mapping.
Thank you,
Andrea
Sure, of course. In fact, I would recommend that.
Delete