Yesterday evening I posted about some new functions for computing multilocus and multiallelic Hardy-Weinberg frequencies, and for showing the phenotypic distribution expected for polygenic quantitative traits determined by many loci.
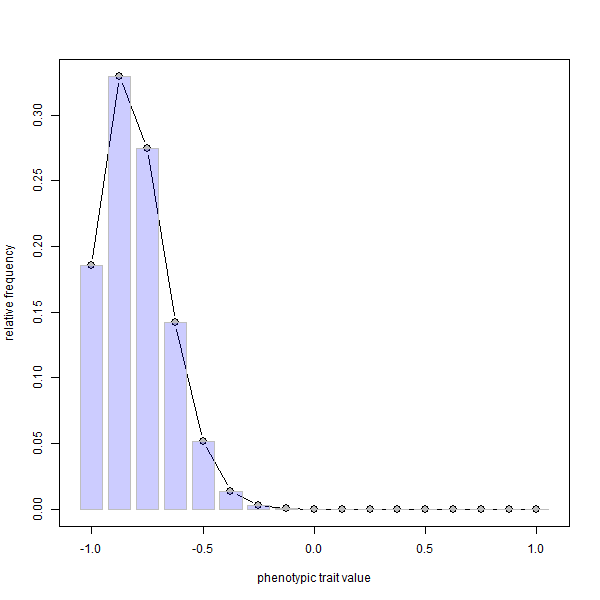
I also developed a function, phenotype.selection, which shows nicely how selection
can result in a change in mean that is well beyond the original range of the phenotype, even in
the complete absence of mutation.
The code update corresponding to this new functionality can be viewed here.
To get it, I recommend just installing PopGen from GitHub:
library(devtools)
install_github("liamrevell/PopGen")
Here's an example of how the function might be used:
phenotype.selection(nloci=8,p=rep(0.1,8),ngen=400)
FYI, since it is not possible to embed animations in knitted HTML, I first made the .gif using ImageMagick called from within R as follows:
png(file="ps-%03d.png",width=600,height=600)
phenotype.selection(nloci=8,p=rep(0.1,8),ngen=400)
dev.off()
system("ImageMagick convert -delay 10 -loop 0 *.png 6Mar18-post.gif")
file.remove(list.files(pattern=".png"))
then I embedded it manually.
nice
ReplyDelete