I've been emailing back & forth with a phytools user to try & explain what is done with paintSubTree, plotSimmap, and phylomorphospace with a mapped regime - but I thought some visuals would help & that some other readers (occasional or otherwise) of this blog might find the clarification useful, so I decided to write this quick post.
The first point is that paintSubTree does not paint the tree with colors. The term paint refers to regime painting in Butler & King (2004); i.e., the process of assigning different branches or subtrees to different a priori specified categories or regimes. The states that we choose to assign to these paintings has nothing at all to do with the colors used to visualize the regimes in (for instance) plotSimmap or phylomorphospace, which (if unassigned by the user) are drawn in sequence from palette().
This is what I mean:
> plotTree(tree,node.numbers=TRUE)
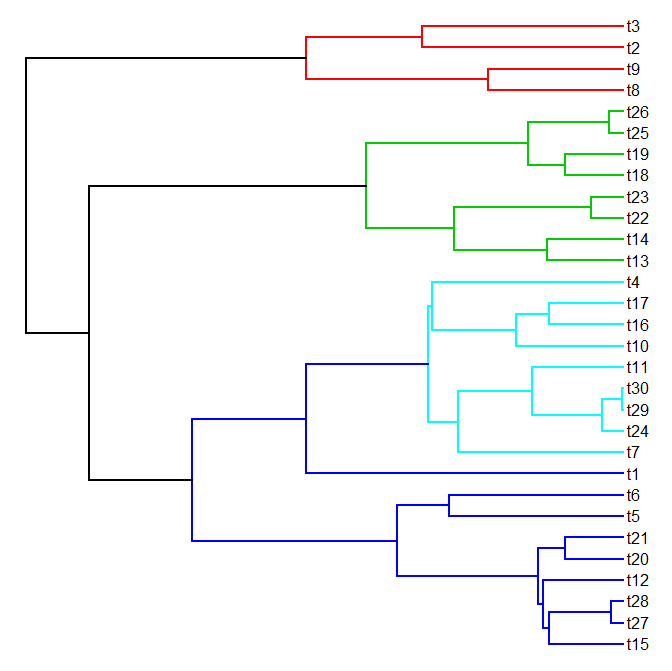
Now let's say we want to paint the subtrees arising from nodes 57, 50, 33, and 42 with different regimes. It doesn't matter why we want to do this - maybe we just want to easily visualize the trees with different subtrees in different colors; nor does it matter that the subtree arising out of node 42 is nested within the subtree arising out of node 33. We can do:
> tree<-paintSubTree(tree,node=50,state="2")
> tree<-paintSubTree(tree,node=33,state="3")
> tree<-paintSubTree(tree,node=42,state="4")
no colors provided. using the following legend:
0 1 2 3 4
"black" "red" "green3" "blue" "cyan"
If we want to use different colors, we can just do:
> names(cols)<-0:4
> plotSimmap(tree,cols,pts=FALSE)
If our sole purpose in painting on regimes was to visualize the tree in this way, we could have used the desired colors as regimes. I.e.,
> tree<-paintSubTree(tree,node=57,state="red")
> tree<-paintSubTree(tree,node=50,state="blue")
> tree<-paintSubTree(tree,node=33,state="green")
> tree<-paintSubTree(tree,node=42,state="purple")
> cols<-colnames(tree$mapped.edge)
> names(cols)<-cols
> plotSimmap(tree,cols,pts=FALSE)
Visualizing different regimes in a phylomorphospace works according to the same principle. Here's a quick demo of that using the same tree:
> phylomorphospace(tree,X,colors=cols,node.by.map=TRUE, xlab="x",ylab="y")
That's really all there is to it.


No comments:
Post a Comment
Note: due to the very large amount of spam, all comments are now automatically submitted for moderation.