Unlike most of the phylogeny plotting functions of phytools which use the multifunctional plotting function plotSimmap internally, the phytools function plotBranchbyTrait is nothing more than a fancy wrapper for the ape S3 plotting method plot.phylo.
The other day a phytools user reported a couple of bugs: (1) when type="fan" the labels plot horizontally instead of radially, as you might expect; and (2) also type="fan" the scale of the plot is all messed up if legend=TRUE and prompt=FALSE (conveniently, the default).
All this havoc resulted just by providing default options for some of things that were well designed to work with certain plot types, but poorly designed for others. I have just posted a fixed version of this function; however users interested in this update should probably just install the latest phytools version from source.
Here is a quick demo:
> packageVersion("phytools")
[1] ‘0.4.27’
> tree<-pbtree(n=50,scale=1)
> x<-fastBM(tree)
> plotBranchbyTrait(tree,x,mode="tips",type="fan", legend=0.4)
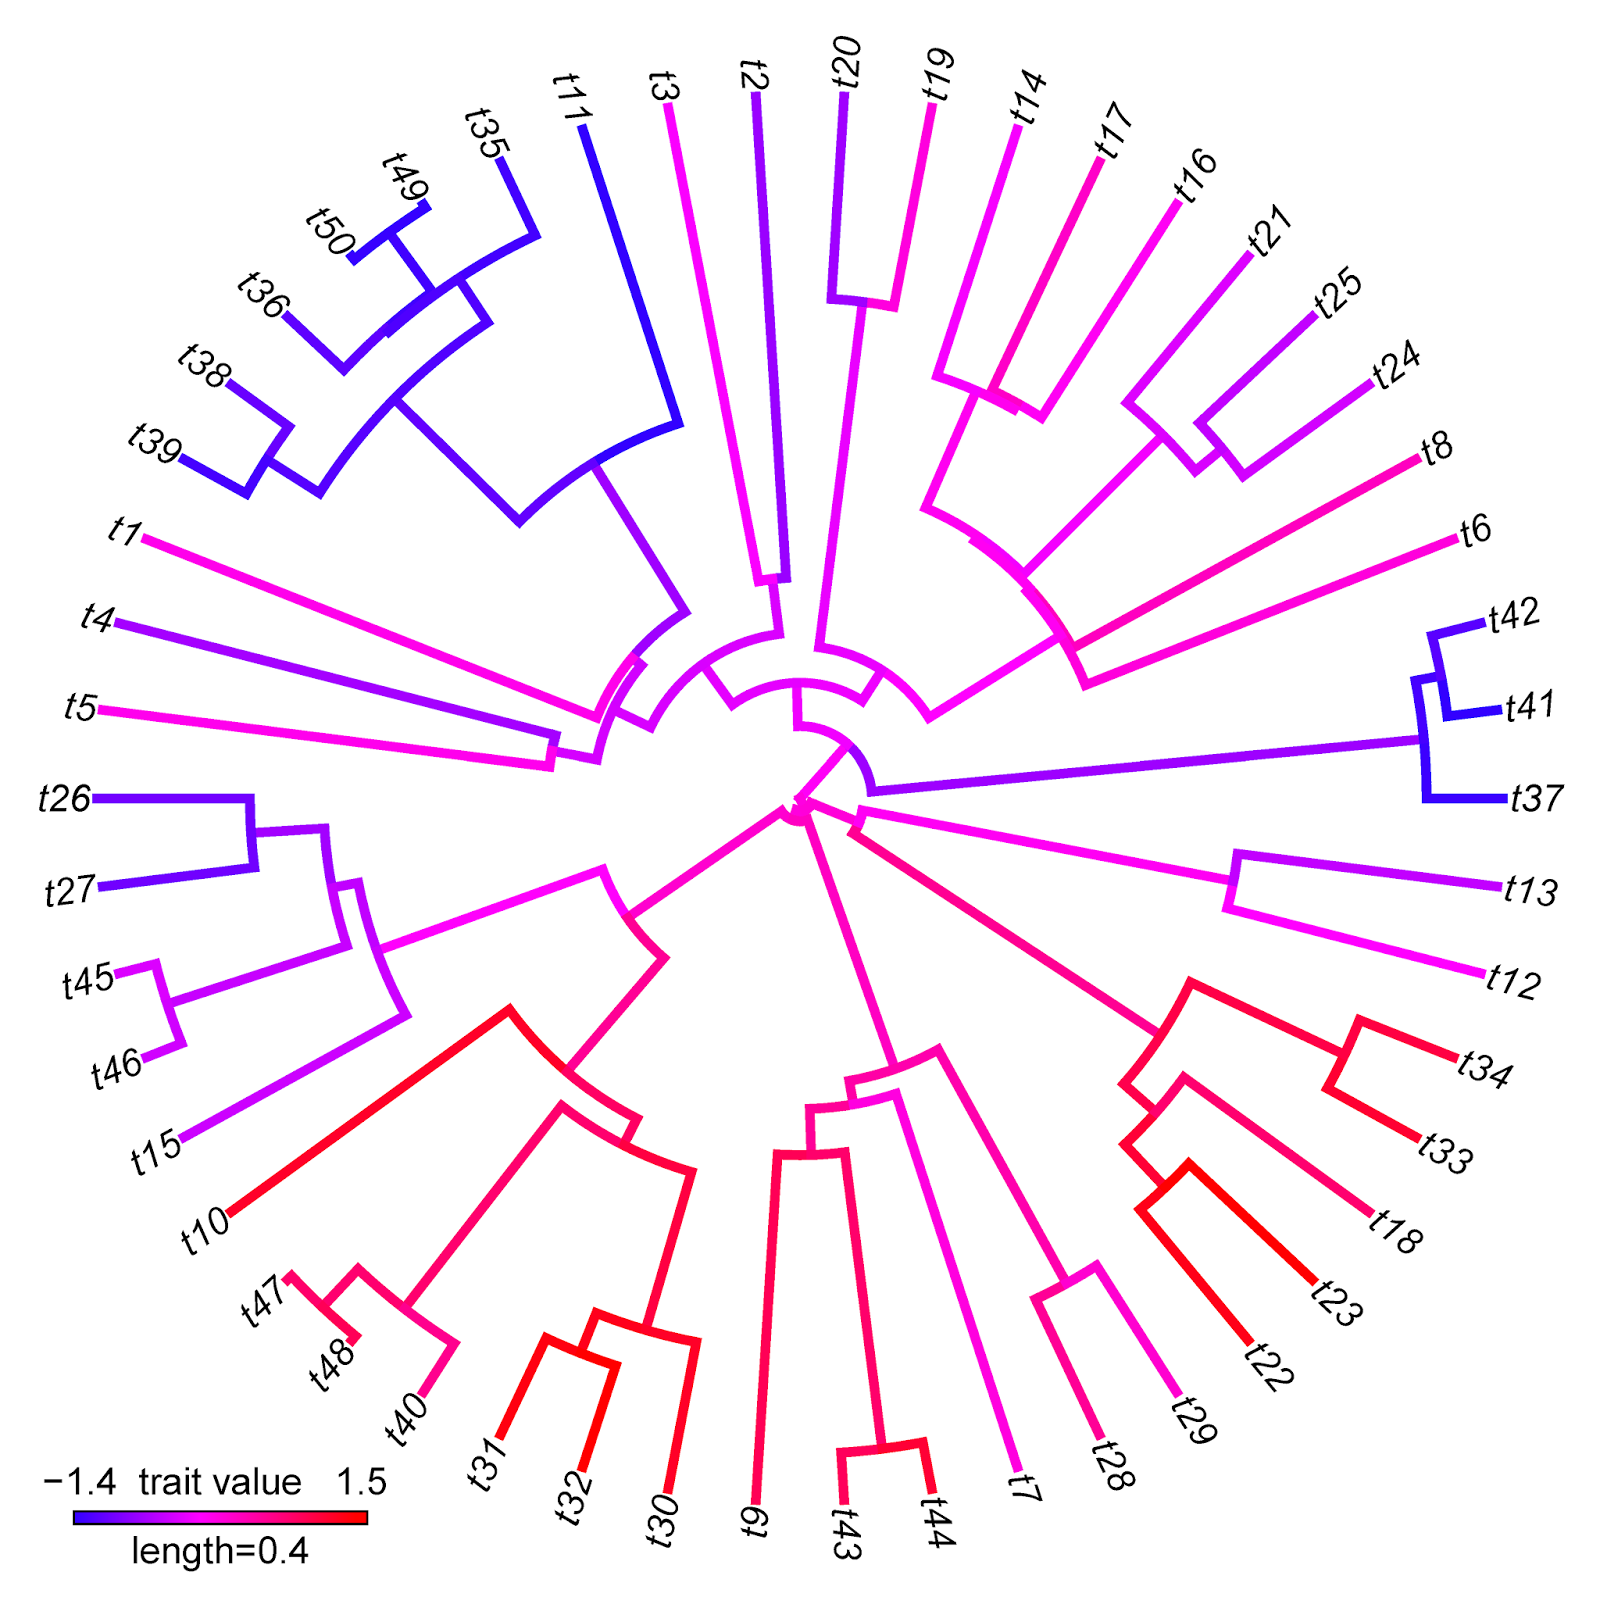
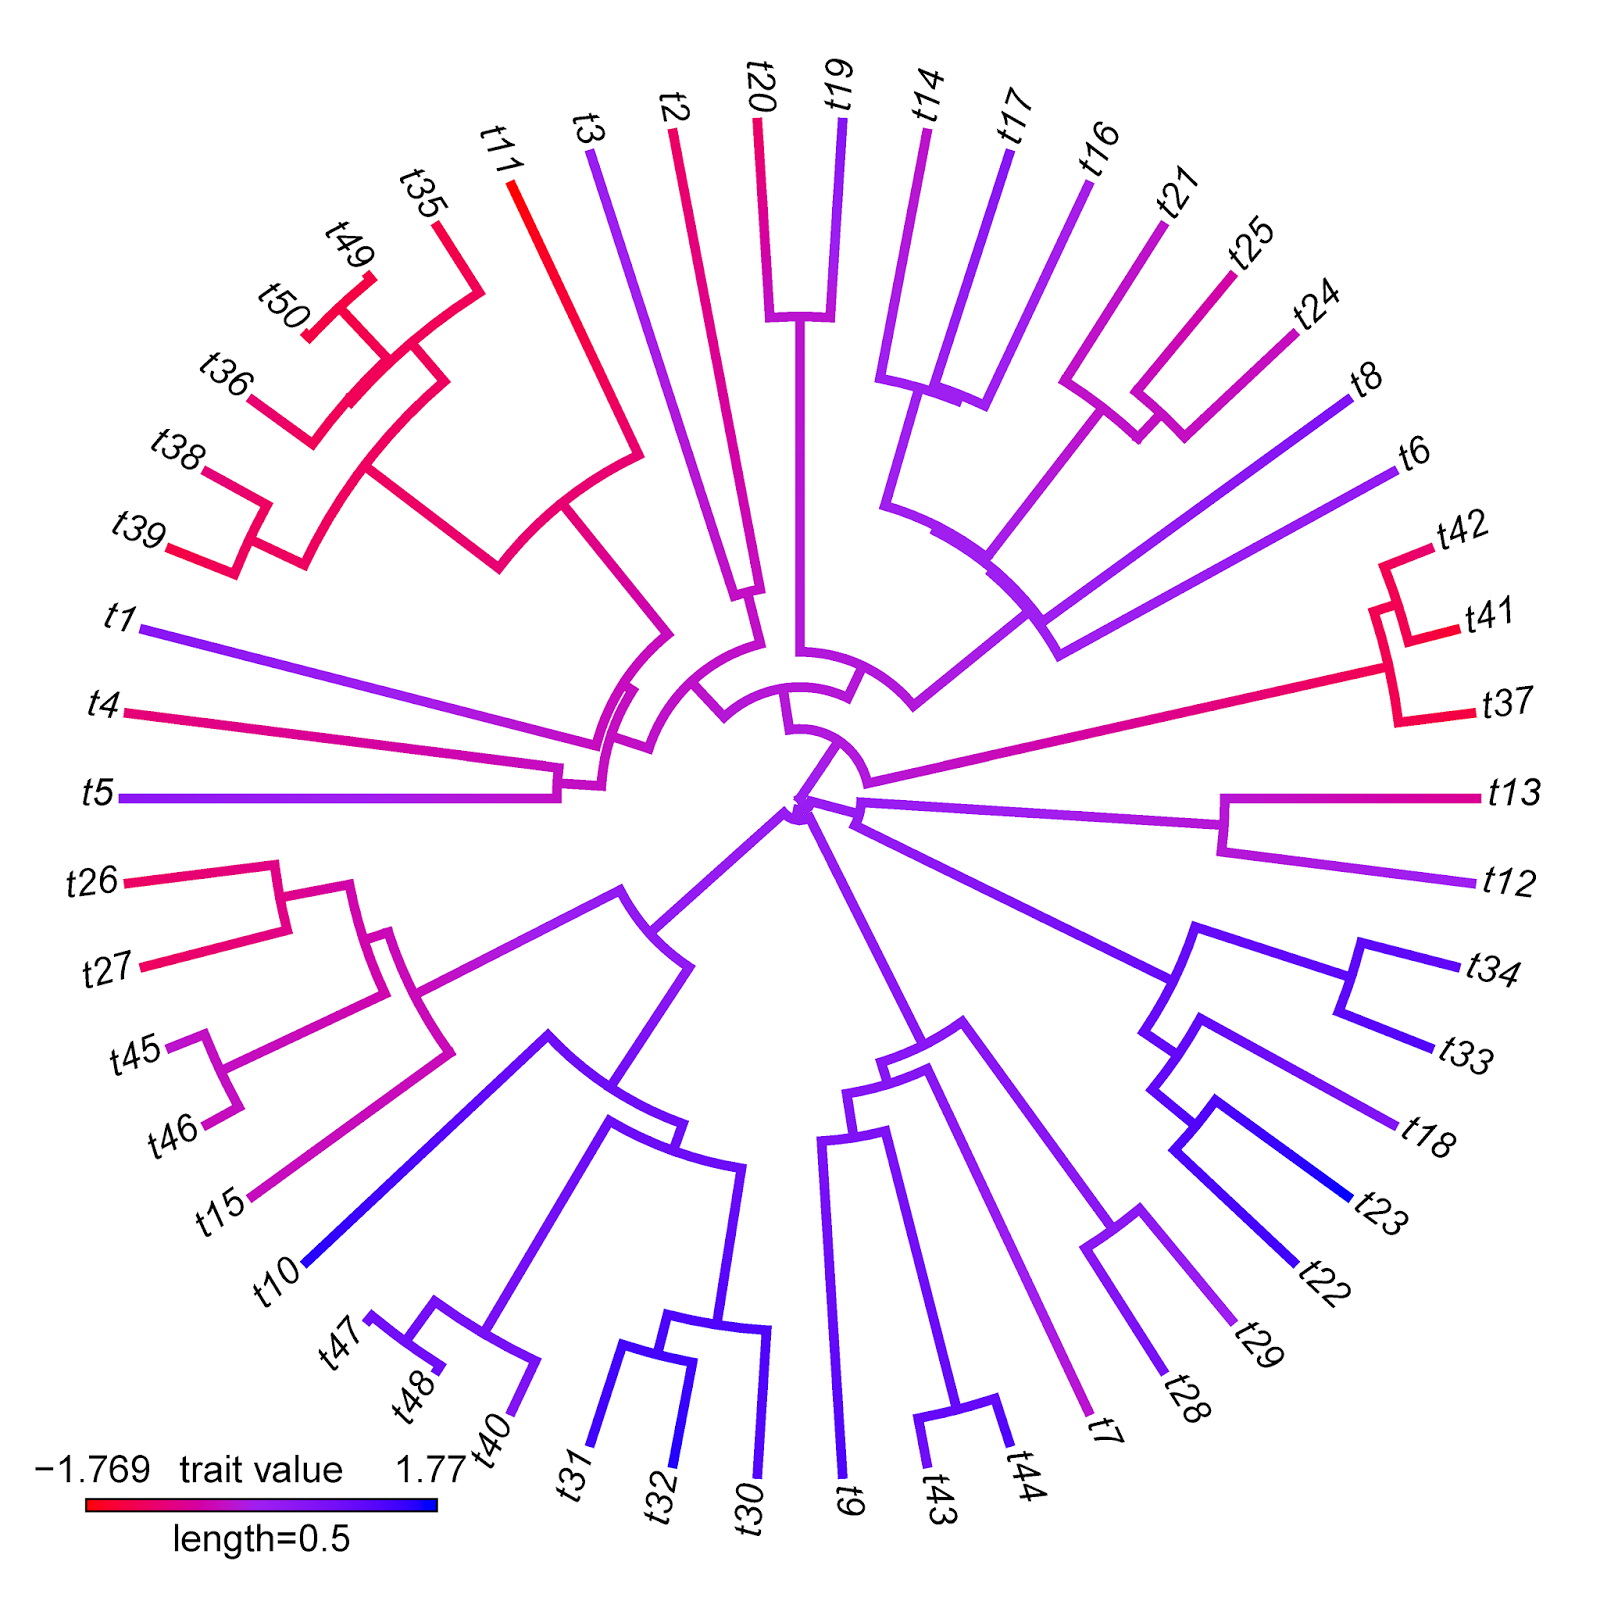
Note that for this specific type of visualization, I would strongly recommend trying my function contMap. Here's a demo of how that would work:
> obj<-setMap(obj,colors=c("red","purple","blue"), space="Lab")
> plot(obj,type="fan",outline=FALSE)
plotBranchbyTrait makes more sense, of course, when we have a trait value associated with each edge that we want to plot on the tree without any interpolation.
Note that there are some interesting differences between these two visualizations that reflect differences between the methods implemented. For instance, the range of trait values in plotBranchbyTrait(...,mode="tips") is narrower than for contMap. This is because plotBranchbyTrait(...,mode="tips"), to get the plotted values for each edge, takes the known or estimated trait values at each end of the edge and averages them. This will invariably contract the range of plotted values when compared to the true range.
No comments:
Post a Comment
Note: due to the very large amount of spam, all comments are now automatically submitted for moderation.