I just wrote another function designed to permit users to interactively draw phylogenies in the R environment.
This one is based closely on a demo I
posted
to my blog a couple of weeks ago showing how to draw a tree using
phytools::bind.tip. This one uses bind.tip in a
couple of different ways - either interactively (as in the case for
method="cladogram" or non-interactively, but via the interactive
phytools (mostly internal - although now exported to the namespace) function
get.treepos.
The following is a quick demo:
library(phytools)

tips<-c("lemur","robin","whale","coelecanth","bat","cow",
    "goldfish","pig","iguana","human")
tips
##  [1] "lemur"      "robin"      "whale"      "coelecanth" "bat"
##  [6] "cow"        "goldfish"   "pig"        "iguana"     "human"
outgroup<-"shark"
outgroup
## [1] "shark"
draw.ultrametric<-function(ingroup,outgroup=NULL,depth=1.0,
    method=c("phylogram","cladogram")){
    method<-method[1]
    if(is.null(outgroup)) out<-"OUTGROUP"
    else out<-outgroup
    tree<-pbtree(n=2,tip.label=c(ingroup[1],out),scale=depth)
    if(method=="cladogram"){
        for(i in 2:length(ingroup))
            tree<-bind.tip(tree,ingroup[i],interactive=TRUE)
        tree$edge.length<-NULL
    } else if(method=="phylogram"){
        dev.hold()
        plotTree(tree,mar=c(0.1,0.1,3.1,0.1))
        v<-seq(0,depth,by=depth/10)
        axis(3,at=v)
        abline(v=v,lty="dashed",col=make.transparent("grey",0.7))
        dev.flush()
        cat(paste("Click where you would like to bind the tip \"",
            ingroup[2],"\"\n",sep=""))
        flush.console()
        for(i in 2:length(ingroup)){
            obj<-get.treepos(message=FALSE)
            tree<-bind.tip(tree,ingroup[i],where=obj$where,
                pos=obj$pos)
            dev.hold()
            plotTree(tree,mar=c(0.1,0.1,3.1,0.1))
            axis(3,at=v)
            abline(v=v,lty="dashed",col=make.transparent("grey",0.7))
            dev.flush()
            if(i<length(ingroup))
                cat(paste("Click where you would like to bind the tip \"",
                    ingroup[i+1],"\"\n",sep=""))
            flush.console()
        }
    }
    tree
}
vertebrates<-draw.ultrametric(tips,outgroup)
plotTree(vertebrates)

[The above example is based on one I use in undergrad classes in which I try to get them to come up with a 'phylogeny of vertebrate' from the following slide:
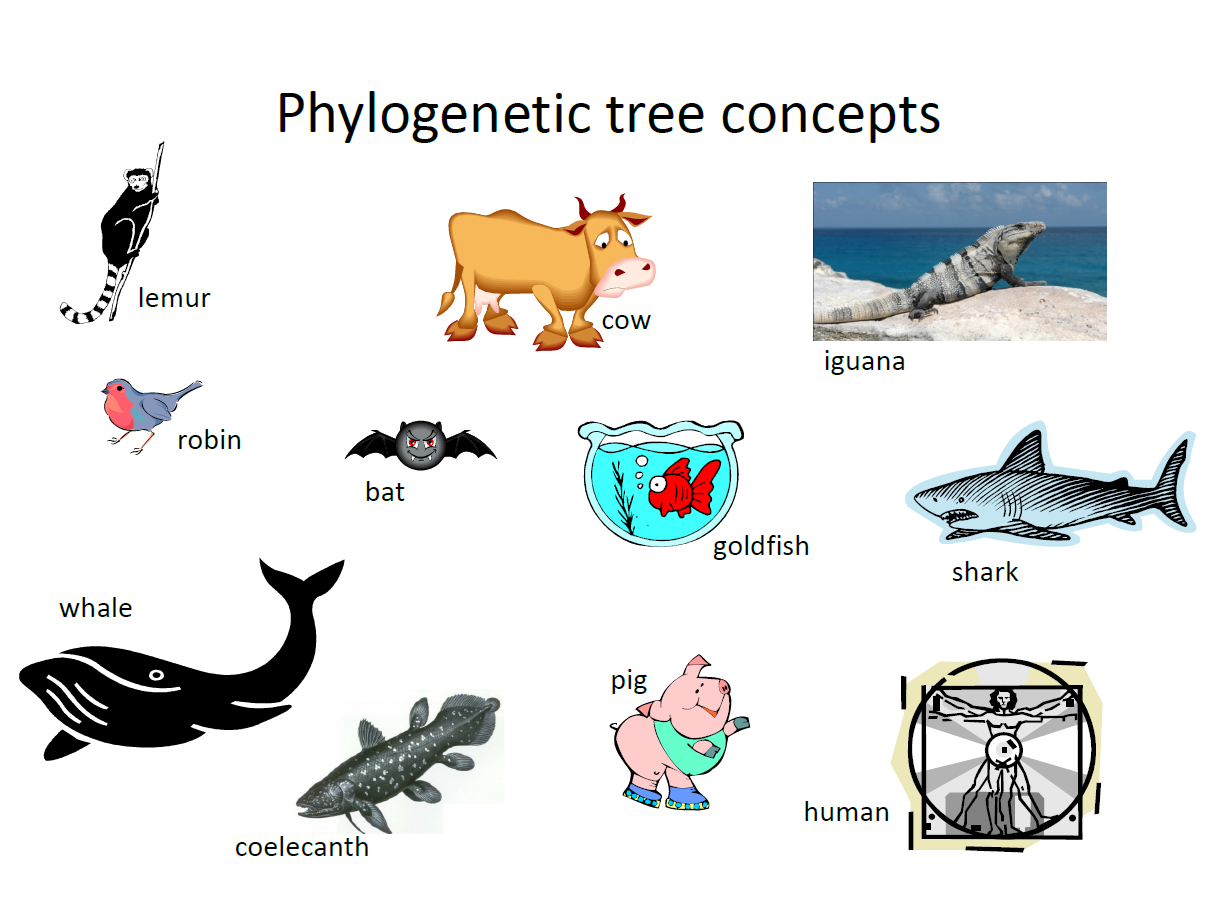
from which they are supposed to draw a tree.]
This function will most likely go in the physketch package.
That's all.
Thanks
ReplyDelete