I want to plot vertical lines indicating various time points on my tree. . . . Is there an easy way to do this in R. . . ?
The answer turns out to be that yes - it is relatively easy to do this using the base function lines. Let's try:
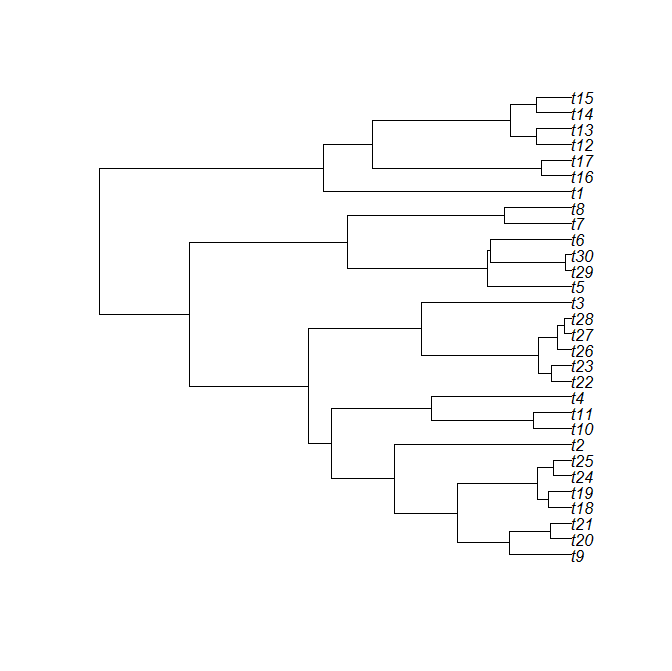
First, let's use pbtree to simulate a tree and plot.phylo to plot it:
> tree<-pbtree(n=30,scale=100)
> x<-plot(tree)
> x
$type
[1] "phylogram"
...
$x.lim
[1] 0.0000 108.3092
$y.lim
[1] 1 30
...
$Nnode
[1] 29
Now let's add lines at 25, 50, and 75 (time units) above the root:
> # with our plotting window still open
> lines(x=c(25,25),y=c(1,30),lwd=2)
> lines(x=c(50,50),y=c(1,30),lwd=2)
> lines(x=c(75,75),y=c(1,30),lwd=2)
> lines(x=c(75,75),y=c(-10,30),lwd=2)

> x<-plot(tree,no.margin=TRUE)
> lines(x=c(25,25),y=c(-10,40),lwd=2)
> lines(x=c(50,50),y=c(-10,40),lwd=2)
> lines(x=c(75,75),y=c(-10,40),lwd=2)

We can do pretty much the same thing using phytools plotTree or plotSimmap, except that we need to keep in mind that these functions automatically rescale the horizontal plotting area (including labels) to unit length. To find the total height of the rescaled tree, we need to subtract the font size × the maximum string width of the tip labels from 1. So, in the case of plotSimmap, we would do:
> # simulate a character history
> tree<-sim.history(tree,Q=matrix(c(-1/20,1/20,1/20,-1/20),2,2))
> # set colors for plotting
> cols<-c("red","blue"); names(cols)<-c(1,2)
> # plot tree
> f<-1 # font size
> plotSimmap(tree,cols,pts=F,fsize=f)
> # add lines
> h<-1-f*max(strwidth(tree$tip.label))
> lines(x=c(0.25*h,0.25*h),y=c(-10,40),lwd=2)
> lines(x=c(0.5*h,0.5*h),y=c(-10,40),lwd=2)
> lines(x=c(0.75*h,0.75*h),y=c(-10,40),lwd=2)

Fot fun, let's combine this with make.era.map:
> tree<-make.era.map(tree,c(0,25,50,75,100))
> plotSimmap(tree,lwd=3,pts=F)
> h<-1-max(strwidth(tree$tip.label))
> lines(x=c(0.25*h,0.25*h),y=c(-10,40),lwd=3,col="red")
> lines(x=c(0.5*h,0.5*h),y=c(-10,40),lwd=3,col="green")
> lines(x=c(0.75*h,0.75*h),y=c(-10,40),lwd=3,col="blue")

Pretty cool.
thanks for posting this Liam. This is really helpful!!!
ReplyDeletematt
abline(v=25) may do this as well, saves some thinking about vertical extent of line (also can do horizontal lines with h=).
ReplyDeleteHi Liam!
ReplyDeleteI know this is very old post, but I am struggling to make a vertical line in my phylo plot for a given cut.
The idea is drawing the line to show a cut of the dendrogram in k groups, rather than a given height.
Any clue?
Hola Borja.
DeleteIs this what you have in mind: http://blog.phytools.org/2016/04/drawing-line-on-slicing-tree-to-create.html? Let me know if this helps.
Saludos, Liam
Yes indeed! Muchas gracias!
DeleteB