I just posted the code for
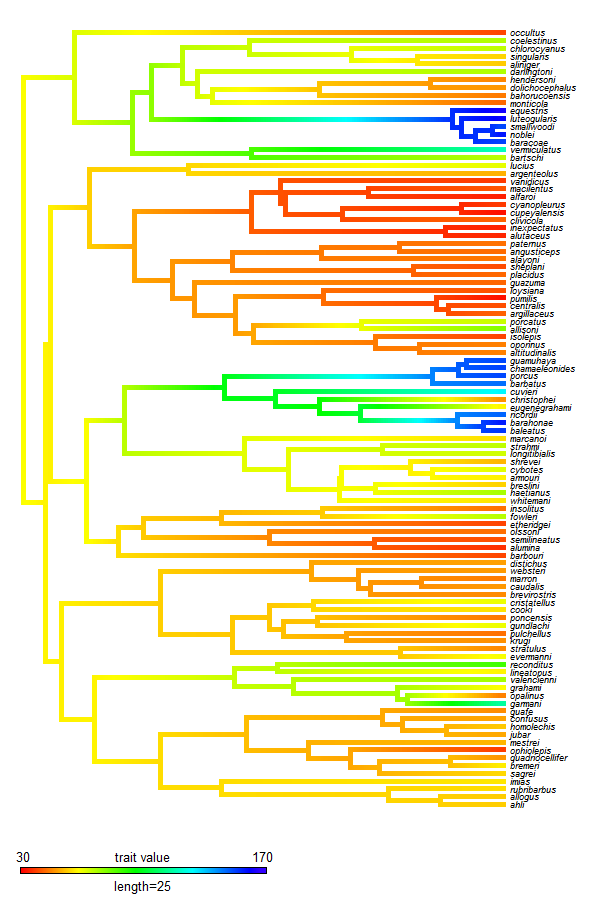
contMap, a new phytools graphing function for plotting the reconstructed value of a continuous character along ancestral branches and nodes in the tree (previously described
here). I made a couple of updates to the function, including some changes that allow the user to specify the trait range of the legend (previously the default was just the range of extant phenotypes). I have also built a new minor (i.e., non-CRAN) version of phytools, v0.2-05, which can be downloaded
here and installed from source. Note that I have a submitted manuscript describing this function and
densityMap (
1,
2). See
help(contMap) for citation information.
Here's a quick demo, including installation from source, again, with the Greater Antillean
Anolis tree and data for SVL (data & tree not included):
> install.packages("phytools_0.2-05.tar.gz",type="source", repos=NULL)
* installing *source* package 'phytools' ...
...
* DONE (phytools)
> library(phytools)
Loading required package: ape
...
> contMap(anoletree,svl,res=200,fsize=c(0.6,0.8),outline=F, lims=c(30,170),lwd=5)
**Note, the difference between this figure and a
prior iteration is because trait values are on mm rather than log(mm) scale; and I have rescaled the total tree length to 50 Ma - based on a
very approximate age for the root of Greater Antillean anoles of 50 mybp (and following Mahler et al.
In review).
Hi Liam!
ReplyDeleteI tried it out and it works and looks amazing! It seems to work very similar to plotPhylo.motmot in the Motmot package. Is their a difference?
Thanks!
Ricardo
Hi Ricardo.
DeleteBased on the example code, it looks like plotPhylo.motmot (although a versatile function in some ways) plots each edge in a single color based on the states at the nodes. (Please correct me if I'm wrong!) contMap computes ancestral states along edges of the tree, as well as at the nodes, and maps ancestral states along edges and nodes.
However, it was also pointed out to me that contMap is similar to a stand-alone software called TreeGradients. This is correct - although TreeGradients does not compute ancestral states, they must be provided.
Thanks for the feedback. Liam
Thank you for the explanation Liam! I'm really liking contMap!
ReplyDeleteDear Liam, I am trying 'contMap', it is giving me an error.:
ReplyDeleteError in while (x> trans [i]) } : missing value where TRUE/FALSE neede
I tried the 'tiplabels' function and it is working fine but not 'contMap', could you help me.
Thanks
Hmmm. Mysterious. I don't recognize the error. Feel free to email me your data file & tree and I will try to replicate it. My email is liam.revell@umb.edu. Thanks!
DeleteHi Liam,
DeleteI am getting the same error as Anon above. Did you find a solution/explanation for it?
many thanks
Christofer
Christofer.
DeleteThis error seems to be normally due to zero length branches (internal or terminal) in the tree. Try:
tree<-di2multi(tree)
before running your analysis.
This can also be a problem if branches are very short & non-zero. This is a bug that I will try to get around to fixing soon.
Let us know if that solves your problem.
- Liam
Hi Liam,
DeleteMany thanks, I am embarrassed to say the problem was my trait values were in a matrix rather than a vector. After transforming using my.vector<-my.matrix[,1] the code works. I hope this helps anyone else.
-Christofer
Hi Liam,
ReplyDeleteThis is a wonderful script. I wonder if it is possible add alternative depictions (radial, fan, etc.). The reason I ask is that this worked really well for a large group (>600 spp) but it's hard to see all the gradations when the branches are so close to one another.
Thanks for any advice,
Daniel
contMap calls plotSimmap (my own plotting function, which unfortunately can only do left & right facing phylograms) internally, so this is not yet possible.
DeleteHowever, you might be interested in the phytools function plotBranchbyTrait (http://blog.phytools.org/2013/03/using-plotbranchbytrait-to-plot.html, and also search for the function). It plots each branch a single color - but this might be good enough if you have a large phylogeny. In addition, it calls plot.phylo from 'ape' internally, so it can plot all the styles of plot.phylo.
- Liam
Hello Liam,
ReplyDeleteI am trying to map a continuous trait on a phylogeny and use contMap to visualize it. however I am not getting the correct trait values for the tips of the tree. Does the vector of values have to be in a particular order with regards to the tree tip labels?
thanks.
No. The vector just has to have the tip labels of the tree in names(x). For example:
Deletetree<-pbtree(n=26,tip.label=LETTERS)
x<-fastBM(tree)
contMap(tree,x)
contMap(tree,sample(x))
should produce the same plots.
- Liam
This comment has been removed by the author.
ReplyDeleteDear Liam,
ReplyDeleteThank you for the post, it is very helpful.
I am using contMap to map the traits into a phylogeny. However, I don't want to reconstruct the ancestral state. I tried to use the argument method = NULL, but it does not seems to work. Is there a way to use the contMap, without reconstructing the ancestor? and so, the branch lengths will be normally in black? I do not want to lose the continuous color gradient of contMap.
Thanks