I'm wondering if there is a way to plot a phylogeny in R that is broken up and displayed side by side to condense space. I've made a backbone in R that i'd like to make into a figure, but it is too tall. If this isn't the write setup, could someone suggest what program (and format for me to write.tree) from R. I am using windows, in terms of potential third part programs.
Well, I thought this sounded like a neat idea. We often see trees plotted this way in published articles, but there is no native function in R to produce this kind of plot. Unfortunately, I didn't have time to work on this until recently - so most likely, the author of the R-sig-phylo question has already solved this problem in some other way. Nonetheless. . . . .
(I should note that, in discussing this function with my friend Luke Harmon, he warned me that I was stuck in the "paper paradigm" - for more on what that means, see Luke's article with James Rosindell.)
Ignoring Luke (as is my wont), I just posted a function for this anyway. The function, splitplotTree, can be downloaded from my phytools page (direct link to code here).
A little bit about how I did this. . . . To plot a phylogram we need two coordinate matrices: a matrix for the heights of the nodes above the root; and a matrix for the vertical position of the edges. We get the former for a "phylo" object by using (say) nodeHeights in phytools. To get the latter, we can just evenly space the tip nodes on our vertical axis (for a rightward facing tree); and then work down through their common ancestors to the root, averaging the vertical position of the descendant nodes to obtain the height of each parent.
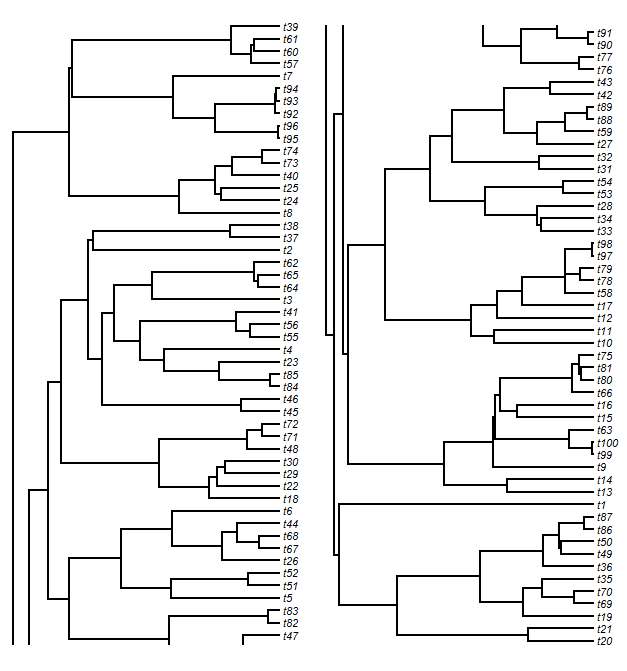
Having done this, to split the tree horizontally we just have to select a cutting point. Then we split our matrices based on this point. After some adjustments, we plot our trees in each plot window. Finally, we have to plot the vertical lines (the lines connecting daughter edges) that would normally connect the two plots. This is easy. For the upper panel tree slice, we just plot a line from each unmatched node to the lower edge of the plot; and for the lower panel tree, we do the opposite. The result will look something like this:
> library(phytools)
> source("splitplotTree.R")
> tree<-pbtree(n=100)
> splitplotTree(tree,fsize=0.7,ftype="i",split=0.5)
> source("splitplotTree.R")
> tree<-pbtree(n=100)
> splitplotTree(tree,fsize=0.7,ftype="i",split=0.5)
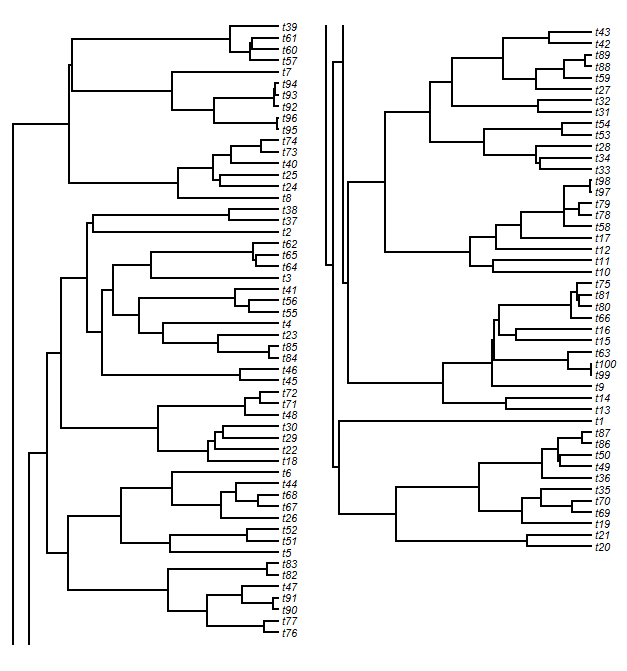
We might look at this and decide that we don't like the look of the slice point split and would prefer to break the tree, say, between tips t76 and t43. After some fiddling, we can figure out where that split point needs to be:
> splitplotTree(tree,fsize=0.7,ftype="i",split=0.54)
If we would rather plot our tree in two windows, rather than in side-by-side panels (say, for publication across two journal pages), we can do that too.
> splitplotTree(tree,fsize=0.7,ftype="i",split=0.54, new.window=TRUE)
Panel 1:


And the code used to do this (minus functions for saving frames to movie file for external viewing):
# code for animation
layout(matrix(c(1,2),1,2))
plotTree(anoletree,fsize=0.7,ftype="i"); layout(1)
for(i in 198:2) splitplotTree(anoletree,split=i/200,fsize=0.7,ftype="i")
layout(matrix(c(2,1),1,2))
plotTree(anoletree,fsize=0.7,ftype="i"); layout(1)
layout(matrix(c(1,2),1,2))
plotTree(anoletree,fsize=0.7,ftype="i"); layout(1)
for(i in 198:2) splitplotTree(anoletree,split=i/200,fsize=0.7,ftype="i")
layout(matrix(c(2,1),1,2))
plotTree(anoletree,fsize=0.7,ftype="i"); layout(1)
That's it!
Looking at the example -last figure above the video-, a nice addition would be a way to visually highlight where the cut branches should "merge" or "paste". For example one could match the branch connecting mrca(t43-t13)and the branch mrca(t38-t76)(above/below) if both if the lines share the same edge.lty (and dicriminate from the line alongside in a case more "tangled"). Best
ReplyDeleteHi Andres -
Deleteedge.lty is an argument of ape::plot.phylo, not a graphical parameter, and splitplotTree does not use plot.phylo. (For one reason or another, some people find it hard to believe that I wrote all the tree plotting functions of 'phytools' de novo, without any dependence on or code from plot.phylo - but it's true!)
Still, it wouldn't be hard to identify matching ends by line type, color, or even a symbol. There are only a limited number of (sensible and readily identifiable) line types, however, but there is no limit on how many lines cross between panels. That being said, having more than a few crossing lines would make for a plot that is very confusing.
Thanks for the suggestion! Perhaps in a future version.
- Liam
Thanks for the reply. Sorry I must have said "line types" or something like that I didn't mean the exact function. By the way, phytools is an amazing work, I am already having nice results with the xkcd trees and other stuff.
DeleteBest
Andres - Great! Thanks for the feedback on phytools. Much appreciated. All the best, Liam
DeleteMy question regarding phylo signal --
ReplyDeleteI’m working on a comparative phylogenetic project and want to show that my data has phylogenetic signal.
Using Pagel’s lambda I get lambda – 0.854. Is this value significant enough in that it’s safe to model the variable as Brownian motion?
Another aspect of Pagel’s lambda method is tree transformation and I don’t actually understand when the transformation is happening (or should happen).
Should I transform my tree (using lambdaTree, for lambda = 1) to model my data? I’ve gone through all the possible tutorials and examples but still don’t understand if I should transform my tree before modeling my trait or if stating the lambda value is enough?
I just posted a reply to at least your first question here.
DeleteThanks Liam! That was my original post. I ended up publishing the backbone with insets for each clade overlayed. It's true, i was stuck in a paper paradigm, but as long as there are papers...
ReplyDeleteI like your solution, thanks again for the interest.
Glad to hear it. Hope that this of use to others. Liam
DeleteThis comment has been removed by the author.
ReplyDeleteIs there a way to pass the product of describe.simmap (which seems like a list) along splitplotTree so one can have a better visualization? Thanks!
ReplyDelete