Here's a demo. First download the package source (popgen 0.2).
> install.packages("popgen_0.2.tar.gz",type="source", repos=NULL)
...
* DONE (popgen)
> payoff<-matrix(c(0.6,1.5,0.5,1.0),2,2,byrow=T)
> colnames(payoff)<-rownames(payoff)<-c("hawk","dove")
> payoff
hawk dove
hawk 0.6 1.5
dove 0.5 1.0
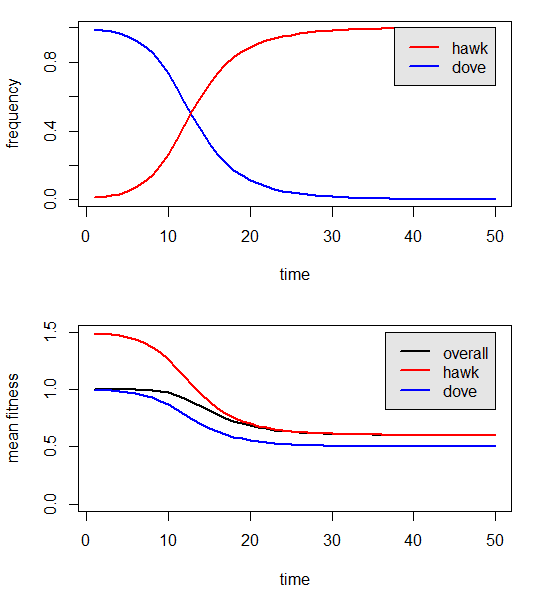
> hawk.dove(M=payoff,time=50)
Pay-off matrix:
hawk dove
hawk 0.6 1.5
dove 0.5 1.0
...
* DONE (popgen)
> payoff<-matrix(c(0.6,1.5,0.5,1.0),2,2,byrow=T)
> colnames(payoff)<-rownames(payoff)<-c("hawk","dove")
> payoff
hawk dove
hawk 0.6 1.5
dove 0.5 1.0
> hawk.dove(M=payoff,time=50)
Pay-off matrix:
hawk dove
hawk 0.6 1.5
dove 0.5 1.0
That's it.
BTW - I should've mentioned that I did this for my 'Animal Behavior' class that I'm teaching this semester.
ReplyDeleteI just wrote a tutorial for my students: http://faculty.umb.edu/liam.revell/classes/hawk-dove.html.
ReplyDelete