library(phytools)
# load source
source("phenogram.R")
# simulate tree & data
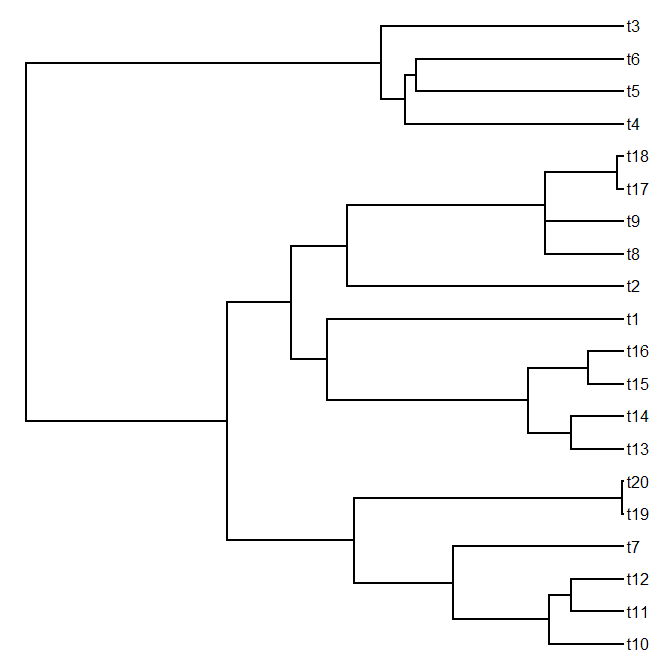
tree<-pbtree(n=20)
plotTree(tree)
# load source
source("phenogram.R")
# simulate tree & data
tree<-pbtree(n=20)
plotTree(tree)
x<-fastBM(tree)
# estimate ancestors
A<-fastAnc(tree,x,CI=TRUE)
tree<-paintSubTree(tree,node=length(tree$tip)+1,"1")
# our transparencies
trans<-as.character(floor(0:50/2))
trans[as.numeric(trans)<10]<-
paste("0", trans[as.numeric(trans)<10],sep="")
# plot
for(i in 0:50){
p<-i/length(trans)
phenogram(tree,c(x,(1-p)*A$CI95[,1]+p*A$ace), colors=setNames(paste("#0000ff",trans[i+1],sep=""),1), add=i>0)
phenogram(tree,c(x,(1-p)*A$CI95[,2]+p*A$ace), colors=setNames(paste("#0000ff",trans[i+1],sep=""),1), add=TRUE)
}
phenogram(tree,c(x,A$ace),add=TRUE, colors=setNames("white",1))

Those discontinuities in the probability density at nodes are a function of having multiple (two) lineages and then meeting and becoming one lineage, yes?
ReplyDeleteAnyway, this is awesome! Made my day.
Yes - that's right.
ReplyDeleteThis is very cool! also kind of reminds me of Densitree - a way of visualizing gene trees over a species tree
ReplyDeletehttp://www.cs.auckland.ac.nz/~remco/DensiTree/DensiTree.html
A slightly more correct way of doing this would be to use the variances instead of the 95% CIs. These are returned by fastAnc in phytools 0.2-20 using fastAnc(...,vars=TRUE). Then, we can just plot the color transparency as a Gaussian (instead of linear) function of the distance from the MLE and the variance on the estimate. I tried this - but with the current approach this too is imperfect because when the variance is low multiple lines of similar transparency overlap creating a darker color and the impression of greater probability density. - Liam
ReplyDeleteSo Cool! Definitely going to play with this! Thanks Liam!
ReplyDeleteHi Liam,
ReplyDeleteI have been trying to replicate this code as it is here and also with my data and keep getting the following error in both cases:
Error in fastAnc(tree, x, CI = TRUE) : unused argument(s) (CI = TRUE)
Am I doing something wrong?
Thanks!
Ricardo
Hi Ricardo.
DeleteI'd guess it's because you don't have the latest version of 'phytools'.
My recommendation is that you install the latest minor version (here) from source.
Alternatively, you can install the latest CRAN version (phytools 0.2-20) and then load the source code for phenogram separately.
One side-note. If you are a Mac user, for some reason the phytools 0.2-20 binary was never built by CRAN. If you can't install from source, then you can download the phytools 0.2-20 MacOS X binary from my website.
Let us know if this fixes your problem.
- Liam