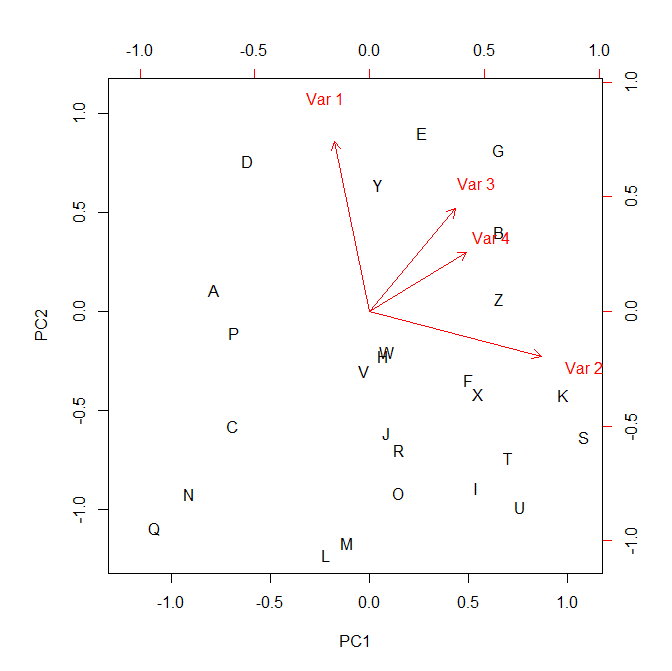
This morning Joan Maspons kindly supplied code for several S3 methods that can be used with the phytools function phyl.pca to return results via print, summary, and biplot that are similar to the equivalent S3 methods for objects of class prcomp. After a few minor tweaks (source code here) I have added these methods to the phytools package. The object returned by phyl.pca is in no way changed (it's merely been assigned the class attribute "phyl.pca"), so any prior functions designed to work with phyl.pca should still function. The updates are in a new minor phytools release phytools 0.3-74.
Here's a quick demo:
> library(phytools)
Loading required package: ape
Loading required package: maps
Loading required package: rgl
> packageVersion("phytools")
[1] ‘0.3.74’
> ## simulate tree
> tree<-pbtree(n=26,scale=1,tip.label=LETTERS)
> ## simulate data
> X<-fastBM(tree,nsim=4)
> ## phylogenetic PCA
> pca<-phyl.pca(tree,X,mode="cov")
> ## S3 print method
> pca
Phylogenetic pca
Starndard deviations:
PC1 PC2 PC3 PC4
1.1851495 1.1200792 0.9641014 0.4812711
Loads:
PC1 PC2 PC3 PC4
[1,] -0.1915766 0.9282404 0.15015897 -0.2812837
[2,] 0.9346040 -0.2431641 -0.03290792 -0.2574947
[3,] 0.4657425 0.5602278 -0.65456104 0.2019371
[4,] 0.5296652 0.3231947 0.74759143 0.2368691
> summary(pca)
Importance of components:
PC1 PC2 PC3 PC4
Standard deviation 1.185 1.120 0.964 0.481
Proportion of Variance 0.368 0.328 0.243 0.060
Cumulative Proportion 0.368 0.696 0.939 1.000
> biplot(pca)

Links fixed now. - Liam
ReplyDeleteHi, I have a question: If there is a correlation between first axes of ordination space using the Brownian model simulations on one hand and principal axes of philogenetic pca from the continuous characters used for phylogenetic tree on the other, it could be evidence that the pattern of evolution of these characters was basically Brownian ..?
ReplyDeleteHello, I have a problem installing this update, I paste the error message:
ReplyDeleteinstall.packages("phytools_0.3-74.zip",repos=NULL)
Installing package into ‘C:/Users/M/Documents/R/win-library/3.0’
(as ‘lib’ is unspecified)
files ‘DESCRIPTION’, ‘NAMESPACE’ have the wrong MD5 checksums
Is phyl.pca compatible with PCAsignificance (BiodiversityR)? I tried to run PCAsignificance on my phyl.pca run and R returned this error: Error in varexplained[2, 1] : subscript out of bounds.
ReplyDeletetwo quick questions: 1) would you only use a PPCA when there is evidence for BM evolution of a trait (lambda=1) and 2) Can the species in a biplot be grouped based on taxonomic groups either with color or ellipses as is done in a typical ordination?
ReplyDelete