Luke Harmon & I just agreed to give a course on phylogenetic comparative methods with the Spanish organization Transmitting Science in October of 2018. That's super far in the future, as far as I'm concerned, but they are already scheduling workshops for that time. The workshop will either be in the catalan village of Els Hostalets de Pierola or in Barcelona itself. Transmitting Science is a small organization based in Barcelona that puts on a variety of workshops in English & Spanish, the majority focused on themes related to evolution, paleontology, morphometrics, and biostatistics.
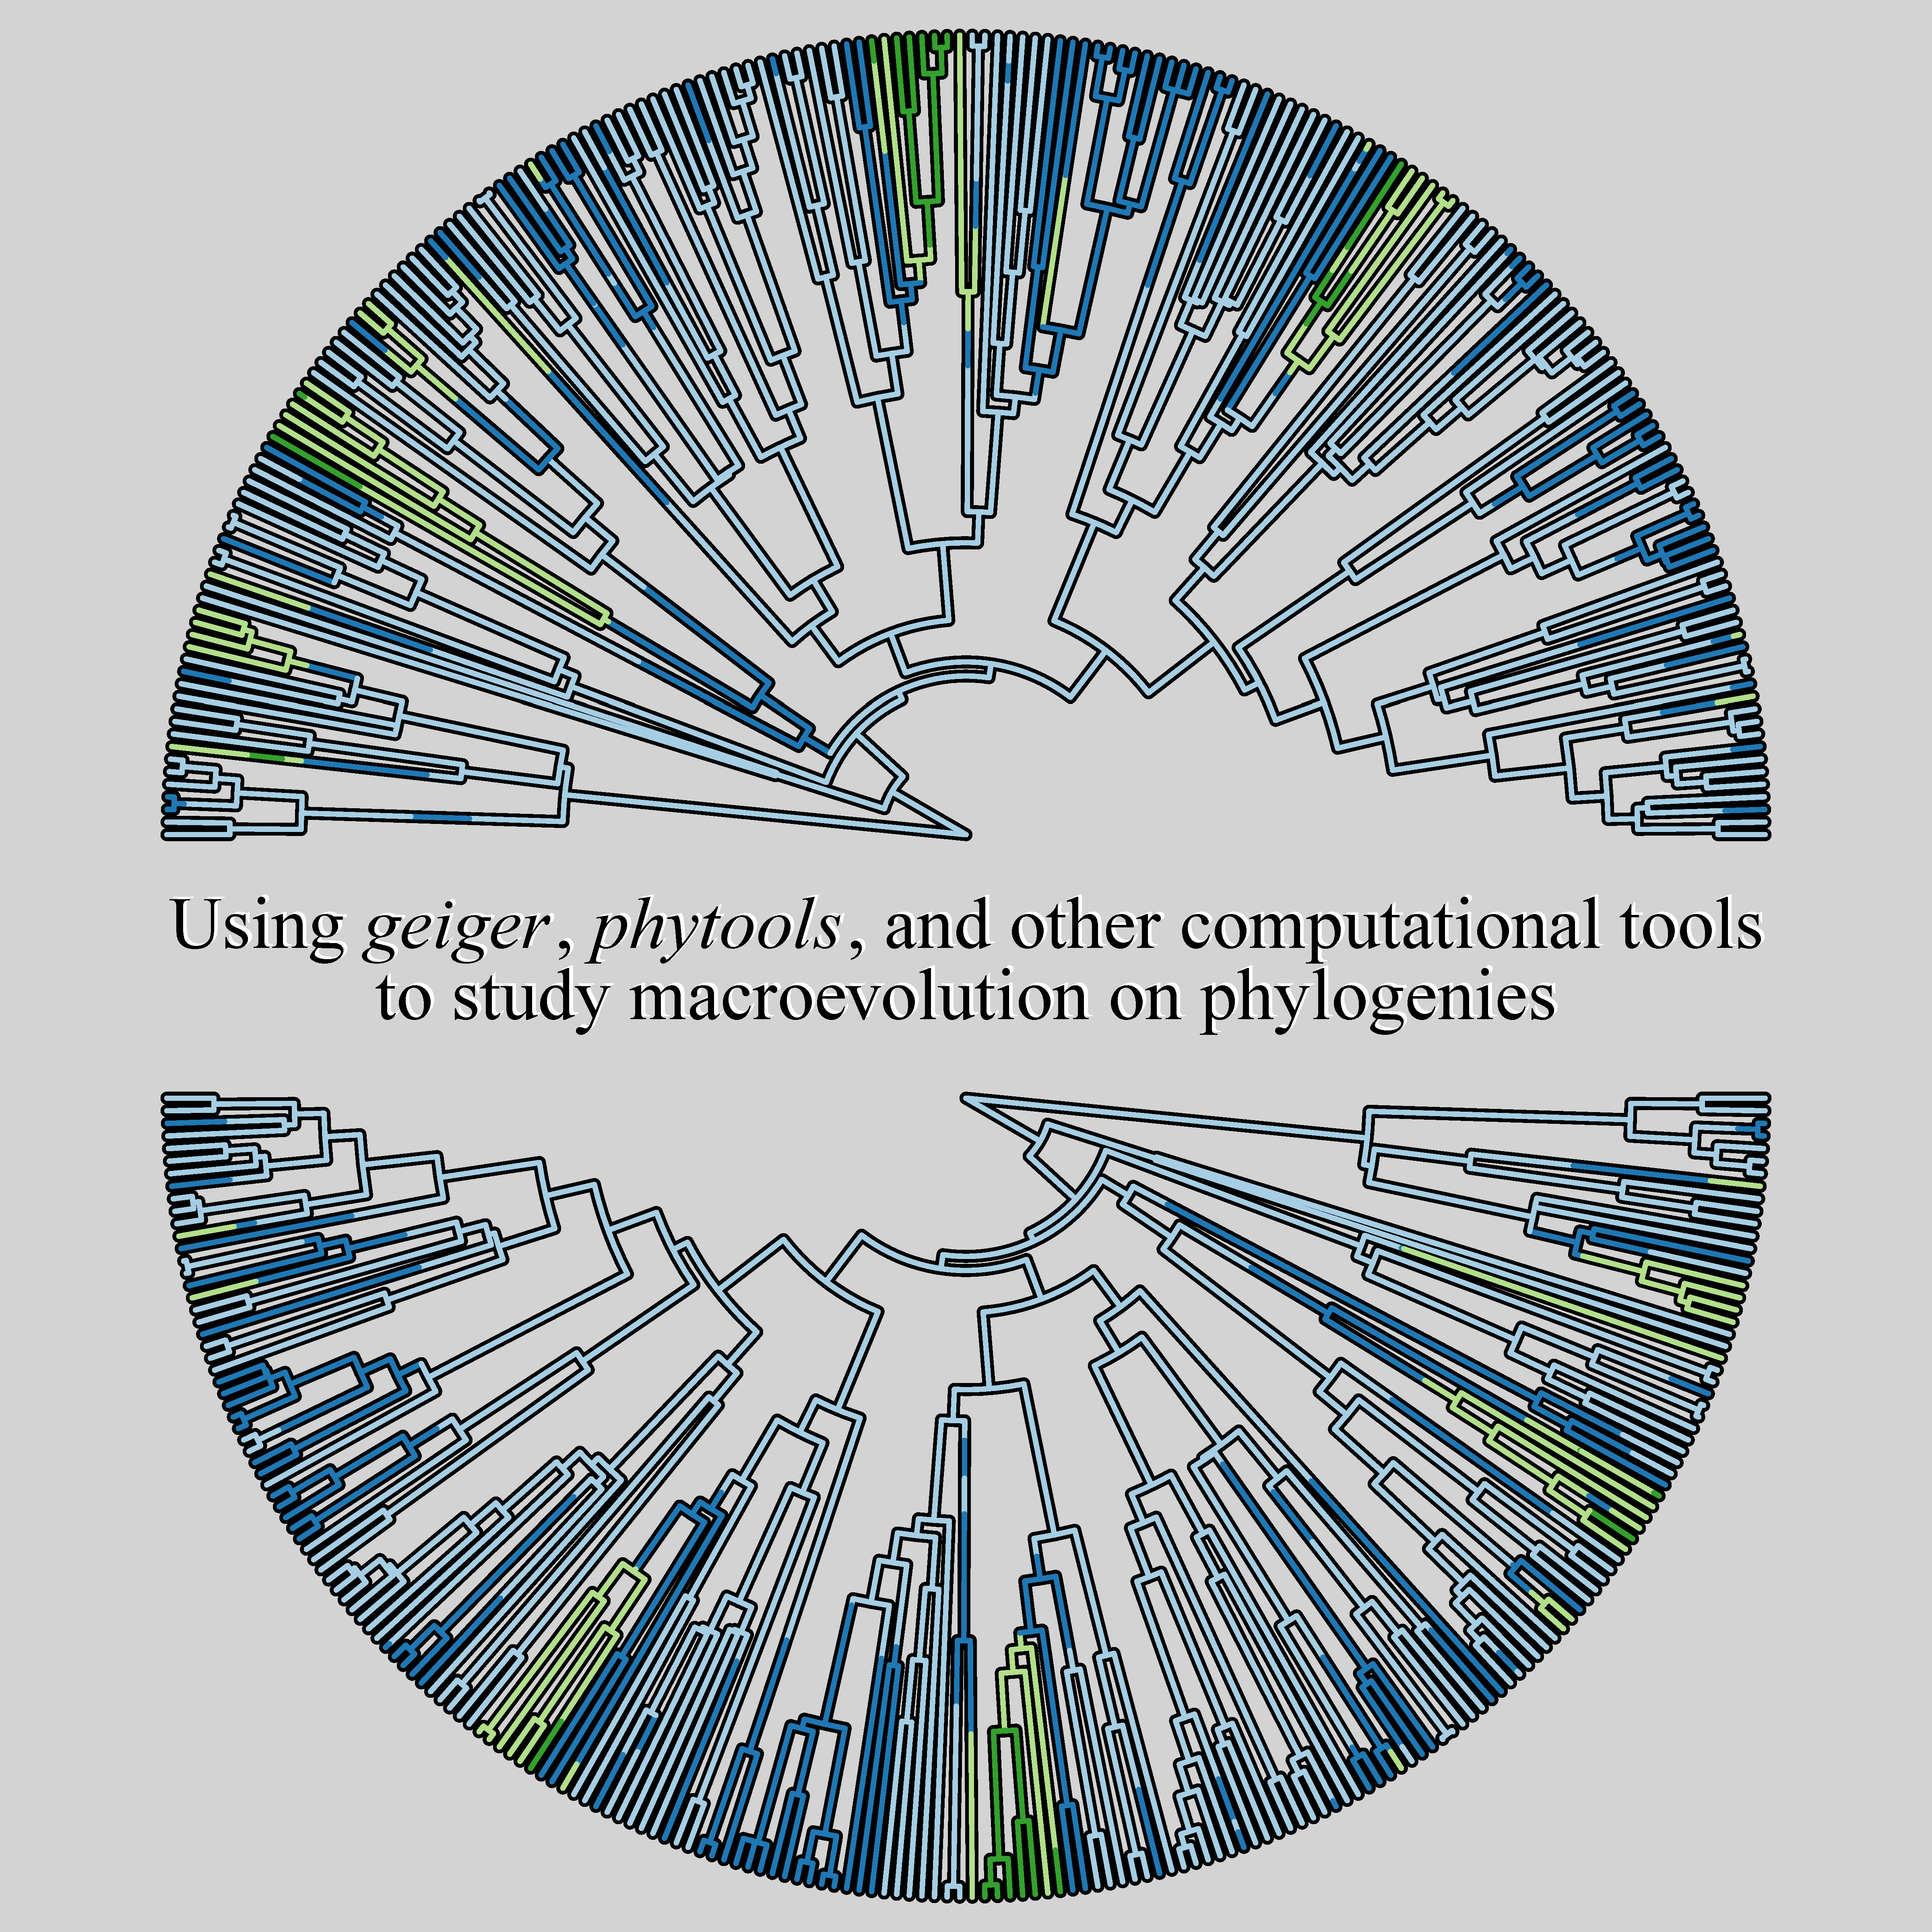
Soledad asked me to create a small image to represent the course and the following is what I came up with:
set.seed(100)
library(phytools)
library(RColorBrewer)
tree<-pbtree(n=200,scale=1)
par(bg="lightgrey")
tree<-ladderize(tree)
Q<-matrix(c(-1,1,0,0,
    1,-2,1,0,
    0,1,-2,1,
    0,0,1,-1),4,4)
x<-sim.history(tree,Q)$states
## Done simulation(s).
ordered<-matrix(c(0,1,0,0,
    1,0,1,0,
    0,1,0,1,
    0,0,1,0),4,4)
layout(matrix(c(1,2,3),3,1),heights=c(0.45,0.1,0.45))
colors<-setNames(brewer.pal(4,"Paired"),1:4)
plotTree(tree,lwd=5,type="fan",ftype="off",part=0.5,lend=0)
plot(make.simmap(tree,x,model=ordered),colors,type="fan",ftype="off",
    part=0.5,add=TRUE,lend=0)
## make.simmap is sampling character histories conditioned on the transition matrix
##
## Q =
##           1         2         3         4
## 1 -1.301317  1.301317  0.000000  0.000000
## 2  1.301317 -2.602634  1.301317  0.000000
## 3  0.000000  1.301317 -2.602634  1.301317
## 4  0.000000  0.000000  1.301317 -1.301317
## (estimated using likelihood);
## and (mean) root node prior probabilities
## pi =
##    1    2    3    4
## 0.25 0.25 0.25 0.25
## Done.
plot.new()
par(mar=rep(0,4))
plot.window(xlim=c(-1,1),ylim=c(-1,1))
h<-strheight("W")
w<-strwidth("W")
text(x=0.15*w,y=2.15*h,cex=2.8,
    expression(paste("Using ",italic("geiger"),", ",italic("phytools"),
    ", and other computational tools",sep="",collapse="")),col="white")
text(x=0.15*w,y=-1.85*h,cex=2.8,
    "to study macroevolution on phylogenies",col="white")
text(x=0,y=2*h,cex=2.8,
    expression(paste("Using ",italic("geiger"),", ",italic("phytools"),
    ", and other computational tools",sep="",collapse="")))
text(x=0,y=-2*h,cex=2.8,
    "to study macroevolution on phylogenies")
plotTree(tree,type="fan",ftype="off",part=0.5,lwd=5,
    xlim=get("last_plot.phylo", envir = .PlotPhyloEnv)$x.lim[2:1],
    ylim=get("last_plot.phylo", envir = .PlotPhyloEnv)$y.lim[2:1],
    lend=0)
plot(make.simmap(tree,x,model=ordered),colors,type="fan",ftype="off",
    part=0.5,add=TRUE,
    xlim=get("last_plot.phylo", envir = .PlotPhyloEnv)$x.lim,
    ylim=get("last_plot.phylo", envir = .PlotPhyloEnv)$y.lim,
    lend=0)
## make.simmap is sampling character histories conditioned on the transition matrix
##
## Q =
##           1         2         3         4
## 1 -1.301317  1.301317  0.000000  0.000000
## 2  1.301317 -2.602634  1.301317  0.000000
## 3  0.000000  1.301317 -2.602634  1.301317
## 4  0.000000  0.000000  1.301317 -1.301317
## (estimated using likelihood);
## and (mean) root node prior probabilities
## pi =
##    1    2    3    4
## 0.25 0.25 0.25 0.25
## Done.

(A few plotting tricks in there!)
Here's a high quality version:

I hope a few readers of this blog decide to enroll in the course!
Hi,
ReplyDeleteIs anything known (even roughly) about the cost of the workshop? I'm actually writing a grant now, and I'd like to include this workshop in the budget.
Thanks!
Brandon
I recommend contacting Soledad with Transmitting Science. They set prices & coordinate all logistics. Her email is here.
Delete