pos<-if(direction=="leftwards") 2 else 4
where 2 and 4 indicate that text should be added to the left of or to the right of the plotting coordinate, respectively.The updated code for plotSimmap is here. The following is a quick a demo of the new version in action:
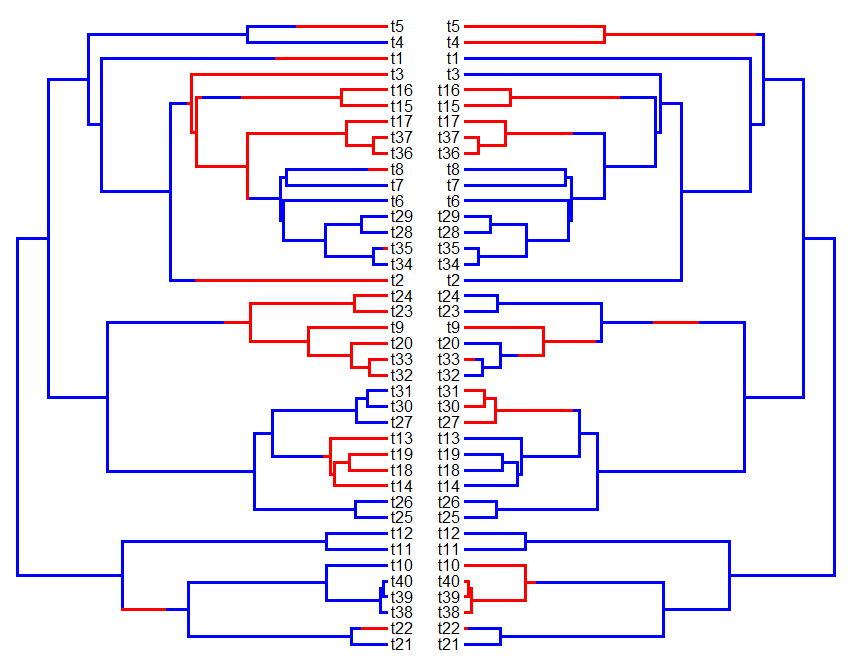
> require(phytools)
> source("plotSimmap.R")
> Q<-matrix(c(-1,1,1,-1),2,2)
> tree<-sim.history(pbtree(n=40,scale=1),Q,nsim=2)
> cols<-c("blue","red"); names(cols)<-c(1,2)
> layout(matrix(c(1,2),1,2))
> plotSimmap(tree[[1]],cols,direction="rightwards",lwd=3, pts=F)
> plotSimmap(tree[[2]],cols,direction="leftwards",lwd=3, pts=F)
That's it for now.
No comments:
Post a Comment
Note: due to the very large amount of spam, all comments are now automatically submitted for moderation.